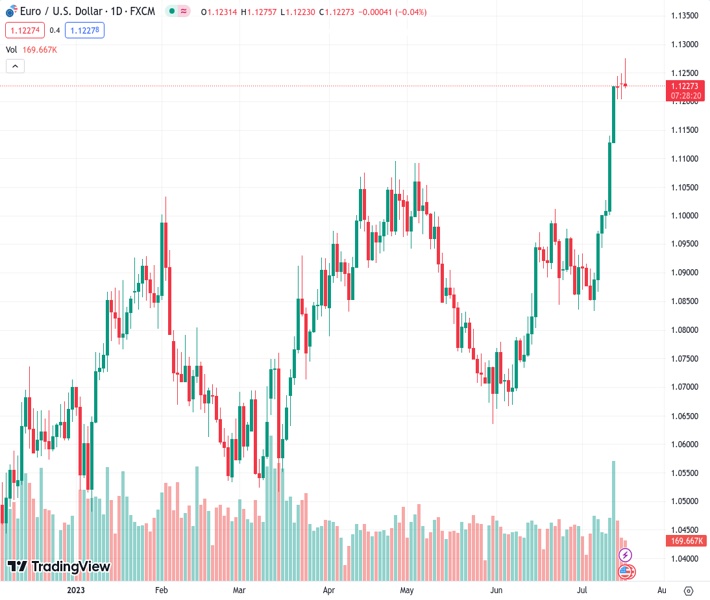
The EUR/USD currency pair at 1.12304 weakens from its previous increase towards the 1.1270 range.
…
This is a premium post.
[s2If !current_user_can(access_s2member_level4)]Please register for FREE REGISTER to read full post below containing analysis. In case of any error or you think you are not able to read the full post below, please email us at support#nehcap.com [lwa][/s2If] [s2If current_user_can(access_s2member_level1)]
- EUR/USD fades the earlier uptick to the 1.1270 zone.
The pair currently trades last at 1.12304.
The previous day high was 1.1249 while the previous day low was 1.1203. The daily 38.2% Fib levels comes at 1.1231, expected to provide resistance. Similarly, the daily 61.8% fib level is at 1.1221, expected to provide support.
EUR/USD retreats from earlier YTD peaks around 1.1275 on Tuesday.
While the continuation of the upside momentum appears favoured in the very near term, the pair’s current overbought conditions (as per the day-to-day RSI near 75) might spark a corrective knee-jerk.
Further north of the 2023 top at 1.1275 (July 18), the pair is expected to meet the next resistance level of note at the 2022 high of 1.1495 recorded on February 10.
Looking at the longer run, the positive view remains unchanged while above the 200-day SMA, today at 1.0666.
Technical Levels: Supports and Resistances
EURUSD currently trading at 1.1235 at the time of writing. Pair opened at 1.1235 and is trading with a change of 0.0 % .
| Overview | Overview.1 | |
|---|---|---|
| 0 | Today last price | 1.1235 |
| 1 | Today Daily Change | 52.0000 |
| 2 | Today Daily Change % | 0.0000 |
| 3 | Today daily open | 1.1235 |
The pair remains strongly bullish on the daily timeframe. It trades above its 20 SMA @ 1.0982, 50 SMA 1.0874, 100 SMA @ 1.086 and 200 SMA @ 1.066.
| Trends | Trends.1 | |
|---|---|---|
| 0 | Daily SMA20 | 1.0982 |
| 1 | Daily SMA50 | 1.0874 |
| 2 | Daily SMA100 | 1.0860 |
| 3 | Daily SMA200 | 1.0660 |
The previous day high was 1.1249 while the previous day low was 1.1203. The daily 38.2% Fib levels comes at 1.1231, expected to provide resistance. Similarly, the daily 61.8% fib level is at 1.1221, expected to provide support.
Note the levels of interest below:
- Pivot support is noted at 1.1209, 1.1184, 1.1164
- Pivot resistance is noted at 1.1255, 1.1275, 1.13
| Levels | Levels.1 |
|---|---|
| Previous Daily High | 1.1249 |
| Previous Daily Low | 1.1203 |
| Previous Weekly High | 1.1245 |
| Previous Weekly Low | 1.0944 |
| Previous Monthly High | 1.1012 |
| Previous Monthly Low | 1.0662 |
| Daily Fibonacci 38.2% | 1.1231 |
| Daily Fibonacci 61.8% | 1.1221 |
| Daily Pivot Point S1 | 1.1209 |
| Daily Pivot Point S2 | 1.1184 |
| Daily Pivot Point S3 | 1.1164 |
| Daily Pivot Point R1 | 1.1255 |
| Daily Pivot Point R2 | 1.1275 |
| Daily Pivot Point R3 | 1.1300 |
[/s2If]
Download Nehcap EAWe have two EAs that are operational on our LIVE accounts.
- EA-FIX: Check out the details here. Download EA-FIX . EA-FIX is a non-grid HFT scalper.
- EA-GROWTH: High quality low dd EA using trend grids. Download EA_GROWTHJoin Our Telegram Group
")


