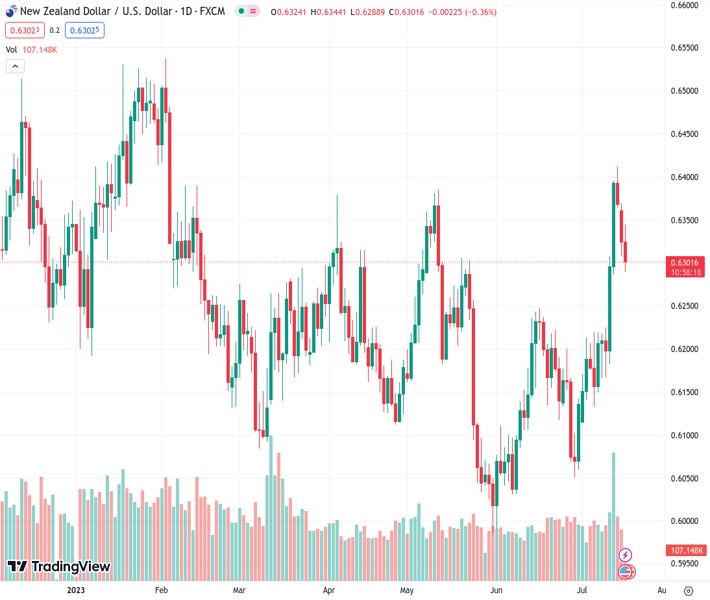
The currency pair NZD/USD is currently hovering around the level of 0.6300, as the USD Index has made a significant attempt at bouncing back.
…
This is a premium post.
[s2If !current_user_can(access_s2member_level4)]Please register for FREE REGISTER to read full post below containing analysis. In case of any error or you think you are not able to read the full post below, please email us at support#nehcap.com [lwa][/s2If] [s2If current_user_can(access_s2member_level1)]
- NZD/USD has dropped to near 0.6300 as the USD Index has attempted a decent recovery move.
The pair currently trades last at 0.62998.
The previous day high was 0.637 while the previous day low was 0.6308. The daily 38.2% Fib levels comes at 0.6332, expected to provide resistance. Similarly, the daily 61.8% fib level is at 0.6346, expected to provide resistance.
The NZD/USD pair has tested territory marginally below the round-level support of 0.6300 in the European session. The Kiwi asset has faced an immense sell-off as the US Dollar Index (DXY) has attempted a solid recovery and investors are worried about Chinese economic prospects.
S&P500 futures have turned choppy ahead of the United States Retail Sales data. Investors are demonstrating marginal caution in an overall upbeat market mood as the second-quarter result season has kicked off. The US Dollar Index has picked strength after testing fresh annual lows of 99.60. For a bullish reversal, the USD Index has to pass through plenty of filters. Currently, the USD Index is broadly bearish.
Investors dumped the US Dollar Index amid hopes that it has lost its broader appeal as the interest rate peak by the Federal Reserve (Fed) is near while other central banks are still raising interest rates. In addition to that, the pace of inflation softening in the United States has remained higher in comparison with other global economies. Eurozone inflation is still near 6% and United Kingdom’s inflation is sticky above 8.5% while headline inflation in the American economy has significantly softened to 3.0% and core inflation has decelerated to 4.8%.
The real action in the USD Index would be driven by US monthly Retail Sales data for June. Analysts at NBF expect auto sales and gasoline station receipts should have increased during the month, which, combined with advances in housing-related categories, should translate into a 0.4% progression for headline sales. Spending on items other than vehicles, meanwhile, might have advanced 0.3%.
On the New Zealand Dollar front, weakness in second-quarter Gross Domestic Product (GDP) figures of China reported on Monday has cautioned investors about the economic outlook. Meanwhile, Morgan Stanley has revised down its China 2023 economic growth forecast by 0.7% to 5% after the country reported a “weak” second quarter GDP reading, reported Reuters.
It is worth noting that New Zealand is one of the leading trading partners of China and China’s weak growth prospects impact the New Zealand Dollar.
Going forward, NZ’s inflation data will be keenly watched, which is scheduled for Wednesday. The quarterly Consumer Price Index (CPI) is seen softening to 0.9% vs. the former pace of 1.2%. Annualized CPI is expected to decelerate to 5.9% against the prior release of 6.7%.
Technical Levels: Supports and Resistances
NZDUSD currently trading at 0.6295 at the time of writing. Pair opened at 0.6324 and is trading with a change of -0.46 % .
| Overview | Overview.1 | |
|---|---|---|
| 0 | Today last price | 0.6295 |
| 1 | Today Daily Change | -0.0029 |
| 2 | Today Daily Change % | -0.4600 |
| 3 | Today daily open | 0.6324 |
The pair remains strongly bullish on the daily timeframe. It trades above its 20 SMA @ 0.6196, 50 SMA 0.6175, 100 SMA @ 0.6194 and 200 SMA @ 0.6193.
| Trends | Trends.1 | |
|---|---|---|
| 0 | Daily SMA20 | 0.6196 |
| 1 | Daily SMA50 | 0.6175 |
| 2 | Daily SMA100 | 0.6194 |
| 3 | Daily SMA200 | 0.6193 |
The previous day high was 0.637 while the previous day low was 0.6308. The daily 38.2% Fib levels comes at 0.6332, expected to provide resistance. Similarly, the daily 61.8% fib level is at 0.6346, expected to provide resistance.
Note the levels of interest below:
- Pivot support is noted at 0.6298, 0.6272, 0.6236
- Pivot resistance is noted at 0.636, 0.6396, 0.6422
| Levels | Levels.1 |
|---|---|
| Previous Daily High | 0.6370 |
| Previous Daily Low | 0.6308 |
| Previous Weekly High | 0.6413 |
| Previous Weekly Low | 0.6166 |
| Previous Monthly High | 0.6250 |
| Previous Monthly Low | 0.5990 |
| Daily Fibonacci 38.2% | 0.6332 |
| Daily Fibonacci 61.8% | 0.6346 |
| Daily Pivot Point S1 | 0.6298 |
| Daily Pivot Point S2 | 0.6272 |
| Daily Pivot Point S3 | 0.6236 |
| Daily Pivot Point R1 | 0.6360 |
| Daily Pivot Point R2 | 0.6396 |
| Daily Pivot Point R3 | 0.6422 |
[/s2If]
Download Nehcap EAWe have two EAs that are operational on our LIVE accounts.
- EA-FIX: Check out the details here. Download EA-FIX . EA-FIX is a non-grid HFT scalper.
- EA-GROWTH: High quality low dd EA using trend grids. Download EA_GROWTHJoin Our Telegram Group
")


