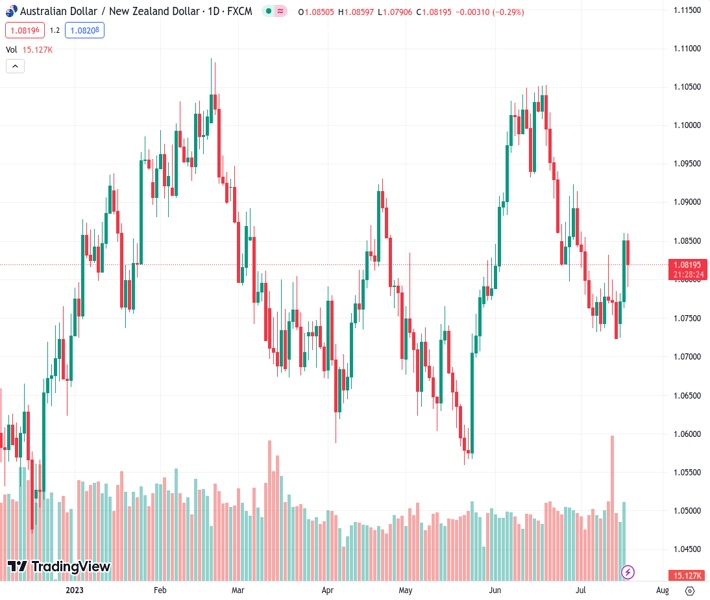
The currency pair AUDNZD, trading at a rate of 1.08190, experiences a decline of 40 pips despite the New Zealand Q2 CPI data supporting the Reserve Bank of New Zealand’s decision to maintain their current position. The opinion of @nehcap suggests that a rebound is anticipated.
…
This is a premium post.
[s2If !current_user_can(access_s2member_level4)]Please register for FREE REGISTER to read full post below containing analysis. In case of any error or you think you are not able to read the full post below, please email us at support#nehcap.com [lwa][/s2If] [s2If current_user_can(access_s2member_level1)]
- AUD/NZD drops 40 pips even as New Zealand Q2 CPI defends RBNZ status quo.
The pair currently trades last at 1.08190.
The previous day high was 1.0782 while the previous day low was 1.0725. The daily 38.2% Fib levels comes at 1.076, expected to provide support. Similarly, the daily 61.8% fib level is at 1.0747, expected to provide support.
AUD/NZD fails to justify downbeat New Zealand inflation numbers on early Wednesday as it slumps to 1.0790 following the data, before recovering to 1.0815 by the press time. In doing so, the exotic pair also takes clues from the overbought RSI while bouncing off the 100-SMA and an upward-sloping support line stretched from Monday.
That said, New Zealand’s (NZ) headline inflation, per the Consumer Price Index (CPI), edges lower to 1.1% QoQ and 6.0% YoY for the second quarter (Q2) of 2023 versus 1.2% and 6.7% respective priors.
Also read: New Zealand Q2 CPI eases to 1.1% QoQ, NZD/USD marches to 0.6300
It should be noted that the bullish MACD signals and the return of the RSI to the normal region, between 70 and 30, defend the AUD/NZD buyers.
With this, the quote is likely to challenge the latest peak of around 1.0860 before eyeing the 200-SMA hurdle surrounding 1.0890.
However, the 1.0900 round figure and a broad horizontal resistance area established since early June, around 1.0915-30, will be crucial for the AUD/NZD bulls to cross afterward if they want to keep the reins.
On the flip side, the 100-SMA and the aforementioned support line restrict immediate AUD/NZD downside near 1.0800-795, a break of which can drag the quote toward the 61.8% Fibonacci retracement of its May-June upside, near 1.0750.
Following that, a descending trend line from May 30, close to 1.0730 at the latest, will act as the last defense of the AUD/NZD buyers.
Trend: Recovery expected
Technical Levels: Supports and Resistances
AUDNZD currently trading at 1.0816 at the time of writing. Pair opened at 1.0777 and is trading with a change of 0.36% % .
| Overview | Overview.1 | |
|---|---|---|
| 0 | Today last price | 1.0816 |
| 1 | Today Daily Change | 0.0039 |
| 2 | Today Daily Change % | 0.36% |
| 3 | Today daily open | 1.0777 |
The pair is trading below its 20 Daily moving average @ 1.0832, below its 50 Daily moving average @ 1.0823 , above its 100 Daily moving average @ 1.079 and below its 200 Daily moving average @ 1.0831
| Trends | Trends.1 | |
|---|---|---|
| 0 | Daily SMA20 | 1.0832 |
| 1 | Daily SMA50 | 1.0823 |
| 2 | Daily SMA100 | 1.0790 |
| 3 | Daily SMA200 | 1.0831 |
The previous day high was 1.0782 while the previous day low was 1.0725. The daily 38.2% Fib levels comes at 1.076, expected to provide support. Similarly, the daily 61.8% fib level is at 1.0747, expected to provide support.
Note the levels of interest below:
- Pivot support is noted at 1.0741, 1.0704, 1.0683
- Pivot resistance is noted at 1.0798, 1.0819, 1.0856
| Levels | Levels.1 |
|---|---|
| Previous Daily High | 1.0782 |
| Previous Daily Low | 1.0725 |
| Previous Weekly High | 1.0832 |
| Previous Weekly Low | 1.0726 |
| Previous Monthly High | 1.1062 |
| Previous Monthly Low | 1.0796 |
| Daily Fibonacci 38.2% | 1.0760 |
| Daily Fibonacci 61.8% | 1.0747 |
| Daily Pivot Point S1 | 1.0741 |
| Daily Pivot Point S2 | 1.0704 |
| Daily Pivot Point S3 | 1.0683 |
| Daily Pivot Point R1 | 1.0798 |
| Daily Pivot Point R2 | 1.0819 |
| Daily Pivot Point R3 | 1.0856 |
[/s2If]
Download Nehcap EAWe have two EAs that are operational on our LIVE accounts.
- EA-FIX: Check out the details here. Download EA-FIX . EA-FIX is a non-grid HFT scalper.
- EA-GROWTH: High quality low dd EA using trend grids. Download EA_GROWTHJoin Our Telegram Group
")


