The Canadian inflation rate has reached its lowest point in 27 months, providing some relief for the Bank of Canada after their recent interest rate increase.
…
This is a premium post.
[s2If !current_user_can(access_s2member_level4)]Please register for FREE REGISTER to read full post below containing analysis. In case of any error or you think you are not able to read the full post below, please email us at support#nehcap.com [lwa][/s2If] [s2If current_user_can(access_s2member_level1)]
- Canadian inflation drops to a 27-month low, relieving pressure on the Bank of Canada following last week’s rate hike.
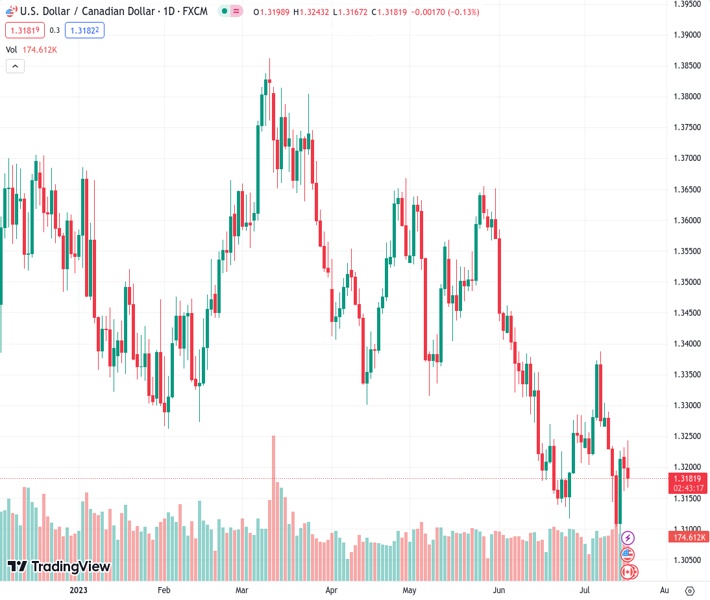
The pair currently trades last at 1.31822.
The previous day high was 1.3232 while the previous day low was 1.3161. The daily 38.2% Fib levels comes at 1.3188, expected to provide resistance. Similarly, the daily 61.8% fib level is at 1.3205, expected to provide resistance.
USD/CAD edges lower after data from Canada and the United States (US) put buyers and sellers in a tug-of-war, with the latter getting the upper hand, as the major prints modest losses of 0.05%. The USD/CAD is trading at 1.3192 at the time of writing., after hitting a daily high at 1.3243.
Statistics Canada revealed that inflation fell to a 27-month low, with the Consumer Price Index (CPI) for June jumped to 2.8% YoY, below estimates of 3%, less than May’s 3.4%. Regarding core CPI, figures came at 3.2%, less than estimates and May’s figures, of 3.2% and 3.7%, each, respectively, easing off pressure on the Bank of Canada (BoC), which lifted rates last week to 5% threshold, which stressed that if incoming data suggested further tightening, they could hike rates further.
In data across the border, US Retail Sales in the past month were more modest than expected, with a 0.2% increment rather than the projected 0.5%. The Core Retail Sales, excluding auto sales, also missed estimates, showing the same slight growth of 0.2%, failing to meet the benchmark of 0.3%.
Other data from the US Federal Reserve showed a noteworthy drop in Industrial Production. The monthly figures highlighted a decrease of -0.5% relative to the preceding month, a disappointing result compared to the predicted 0% growth. Year-over-year predictions had forecasted an increase of 1.1%, yet June’s data presented a shrinkage of -0.4%.
Following the data release, the USD/CAD rallied to a daily high at 1.3243 before making a U-turn that benefited the Canadian Dollar (CAD) bulls. They dragged the USD/CAD pair towards a daily low of 1.3167 before settling around current exchange rates.
The greenback has continued to recover some ground, as shown by the US Dollar Index (DXY). The DXY, which tracks the buck’s performance against a basket of six currencies, advances 0.13%, up at 100.017. Meanwhile, bond yields in the US and Canada are dropping, with the 10-year benchmark note rate sitting at 3.781%, down three bps in the US, while the Canadian 10-year bond yield sits at 3.360%, down four bps.
Given the fundamental backdrop, softer inflation data in Canada could pave the way for USD/CAD upside, as odds stand at a 20% chance the Bank of Canada (BoC) would raise rates 25 bps at the September 6 meeting. Contrarily, the Federal Reserve would hike 25 bps at the upcoming July meeting, with officials reiterating that an additional increase would be needed.
From a technical standpoint, the USD/CAD remains tilted to the downside, set to test initially the June 27 daily low of 1.3116 after USD/CAD sellers claimed the 1.3200 figure. IF USD/CAD drops below 1.3150, the next stop would be the June 27 low, followed by the YTD low of 1.3092. Conversely, if USD/CAD buyers reclaim 1.3200, that will expose the 20-day Exponential Moving Average (EMA) at 1.3237, followed by the 1.3250 psychological level.
Technical Levels: Supports and Resistances
USDCAD currently trading at 1.3188 at the time of writing. Pair opened at 1.3199 and is trading with a change of -0.08 % .
| Overview | Overview.1 | |
|---|---|---|
| 0 | Today last price | 1.3188 |
| 1 | Today Daily Change | -0.0011 |
| 2 | Today Daily Change % | -0.0800 |
| 3 | Today daily open | 1.3199 |
The pair remains strongly bearish on the daily time frame. It trades below the 20 SMA @ 1.3223, 50 SMA 1.3355, 100 SMA @ 1.3468 and 200 SMA @ 1.3489.
| Trends | Trends.1 | |
|---|---|---|
| 0 | Daily SMA20 | 1.3223 |
| 1 | Daily SMA50 | 1.3355 |
| 2 | Daily SMA100 | 1.3468 |
| 3 | Daily SMA200 | 1.3489 |
The previous day high was 1.3232 while the previous day low was 1.3161. The daily 38.2% Fib levels comes at 1.3188, expected to provide resistance. Similarly, the daily 61.8% fib level is at 1.3205, expected to provide resistance.
Note the levels of interest below:
- Pivot support is noted at 1.3163, 1.3126, 1.3091
- Pivot resistance is noted at 1.3234, 1.3269, 1.3305
| Levels | Levels.1 |
|---|---|
| Previous Daily High | 1.3232 |
| Previous Daily Low | 1.3161 |
| Previous Weekly High | 1.3304 |
| Previous Weekly Low | 1.3093 |
| Previous Monthly High | 1.3585 |
| Previous Monthly Low | 1.3117 |
| Daily Fibonacci 38.2% | 1.3188 |
| Daily Fibonacci 61.8% | 1.3205 |
| Daily Pivot Point S1 | 1.3163 |
| Daily Pivot Point S2 | 1.3126 |
| Daily Pivot Point S3 | 1.3091 |
| Daily Pivot Point R1 | 1.3234 |
| Daily Pivot Point R2 | 1.3269 |
| Daily Pivot Point R3 | 1.3305 |
[/s2If]
Download Nehcap EAWe have two EAs that are operational on our LIVE accounts.
- EA-FIX: Check out the details here. Download EA-FIX . EA-FIX is a non-grid HFT scalper.
- EA-GROWTH: High quality low dd EA using trend grids. Download EA_GROWTHJoin Our Telegram Group
")


