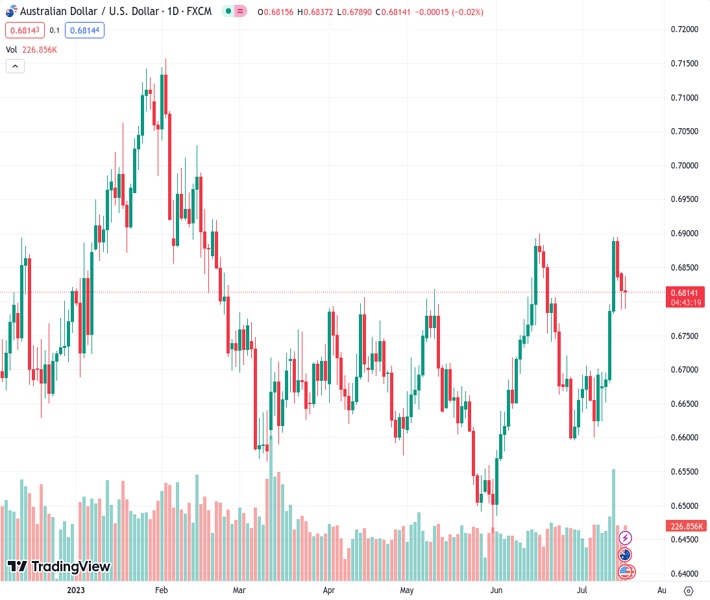
The AUDUSD pair, which is currently at 0.68135, remained within the range of 0.6790 and 0.6838 throughout the day, managing to maintain its daily gains.
…
This is a premium post.
[s2If !current_user_can(access_s2member_level4)]Please register for FREE REGISTER to read full post below containing analysis. In case of any error or you think you are not able to read the full post below, please email us at support#nehcap.com [lwa][/s2If] [s2If current_user_can(access_s2member_level1)]
- The AUD/USD traded in the 0.6790 – 0.6838 range, holding daily gains.
The pair currently trades last at 0.68135.
The previous day high was 0.6854 while the previous day low was 0.6788. The daily 38.2% Fib levels comes at 0.6813, expected to provide support. Similarly, the daily 61.8% fib level is at 0.6829, expected to provide resistance.
On Tuesday, the USD faced additional selling pressure following soft Retail Sales data from June, which helped the AUD/USD clear daily losses and jump back above 0.6800. Following the data, US Treasury yields are in decline, applying further pressure on the Greenback.
The US Census Bureau reported that the Retail Sales from June increased by 0.2%, lower than the 0.5% expected and the previous 0.5% monthly increase. Due to the signs of weakness in the US economy following soft inflation readings, US Treasury bond yields decreased. The 2-year yield fell to 4.70%, while the 5 and 10-year rates to 3.95% and 3.75%, respectively.
On the other hand, the Reserve Bank of Australia (RBA) released its July meeting minutes. They showed that members agreed to pause due to the uncertainty around the economic outlook and the significant tightening up to the date. Regarding the next movements, the minutes showed that the board would reassess the economic situation in the next meeting in August. As for now, according to the World Interest Rates Probabilities (WIRP), markets are discounting a 25 basis point (bps) hike in the next meeting and bet on high probabilities of similar hikes in September and November.
The daily chart suggests that the technical outlook for the AUD/USD has turned neutral for the short term. The Relative Strength Index (RSI) has a positive slope above its midline, while the Moving Average Convergence Divergence (MACD) prints lower green bars. In the 4-hour chart, there is also no clear dominance, as indicators are somewhat flat. However, on the bigger picture, the pair trades above its main daily Simple Moving Averages (SMAs) of 20,100 and 200-days, suggesting that the bulls are in command on the bigger picture.
Resistance Levels: 0.6840,0.6850,0.6890.
Support Levels: 0.6790,0.6740, 0.6715 (20-day SMA).
Technical Levels: Supports and Resistances
AUDUSD currently trading at 0.6821 at the time of writing. Pair opened at 0.6816 and is trading with a change of 0.07 % .
| Overview | Overview.1 | |
|---|---|---|
| 0 | Today last price | 0.6821 |
| 1 | Today Daily Change | 0.0005 |
| 2 | Today Daily Change % | 0.0700 |
| 3 | Today daily open | 0.6816 |
The pair remains strongly bullish on the daily timeframe. It trades above its 20 SMA @ 0.6714, 50 SMA 0.6687, 100 SMA @ 0.6686 and 200 SMA @ 0.6708.
| Trends | Trends.1 | |
|---|---|---|
| 0 | Daily SMA20 | 0.6714 |
| 1 | Daily SMA50 | 0.6687 |
| 2 | Daily SMA100 | 0.6686 |
| 3 | Daily SMA200 | 0.6708 |
The previous day high was 0.6854 while the previous day low was 0.6788. The daily 38.2% Fib levels comes at 0.6813, expected to provide support. Similarly, the daily 61.8% fib level is at 0.6829, expected to provide resistance.
Note the levels of interest below:
- Pivot support is noted at 0.6785, 0.6753, 0.6718
- Pivot resistance is noted at 0.6851, 0.6885, 0.6917
| Levels | Levels.1 |
|---|---|
| Previous Daily High | 0.6854 |
| Previous Daily Low | 0.6788 |
| Previous Weekly High | 0.6895 |
| Previous Weekly Low | 0.6624 |
| Previous Monthly High | 0.6900 |
| Previous Monthly Low | 0.6484 |
| Daily Fibonacci 38.2% | 0.6813 |
| Daily Fibonacci 61.8% | 0.6829 |
| Daily Pivot Point S1 | 0.6785 |
| Daily Pivot Point S2 | 0.6753 |
| Daily Pivot Point S3 | 0.6718 |
| Daily Pivot Point R1 | 0.6851 |
| Daily Pivot Point R2 | 0.6885 |
| Daily Pivot Point R3 | 0.6917 |
[/s2If]
Download Nehcap EAWe have two EAs that are operational on our LIVE accounts.
- EA-FIX: Check out the details here. Download EA-FIX . EA-FIX is a non-grid HFT scalper.
- EA-GROWTH: High quality low dd EA using trend grids. Download EA_GROWTHJoin Our Telegram Group
")


