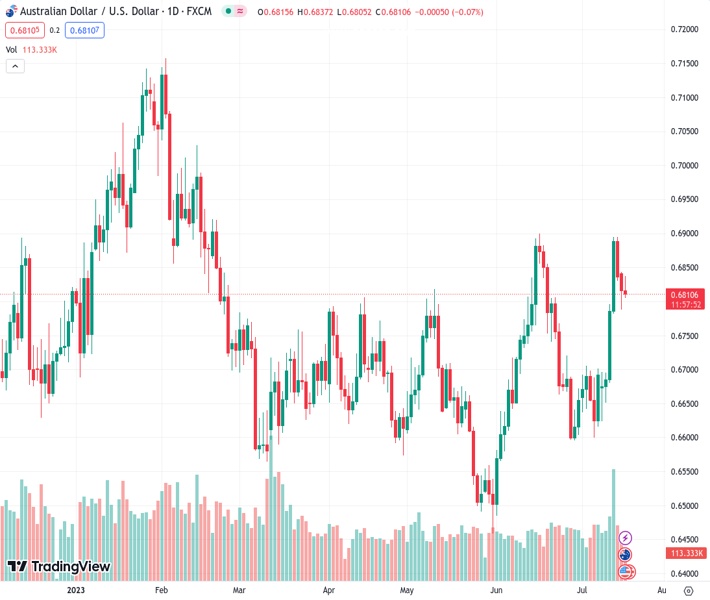
The AUDUSD currency pair, currently at a rate of 0.68074, is experiencing a decline for the third consecutive day. However, the extent of the decrease appears to be somewhat limited.
…
This is a premium post.
[s2If !current_user_can(access_s2member_level4)]Please register for FREE REGISTER to read full post below containing analysis. In case of any error or you think you are not able to read the full post below, please email us at support#nehcap.com [lwa][/s2If] [s2If current_user_can(access_s2member_level1)]
- AUD/USD turns lower for the third straight day, though the downside seems cushioned.
The pair currently trades last at 0.68074.
The previous day high was 0.6854 while the previous day low was 0.6788. The daily 38.2% Fib levels comes at 0.6813, expected to provide resistance. Similarly, the daily 61.8% fib level is at 0.6829, expected to provide resistance.
The AUD/USD pair attracts some sellers following an intraday uptick to the 0.6835 region on Tuesday and drifts into negative territory for the third successive day. Spot prices drop to a fresh daily low during the early European session and currently trade just above the 0.6800 round-figure mark.
Despite the hawkish minutes of the July Reserve Bank of Australia (RBA) policy meeting, the Australian Dollar (AUD) struggles to gain any meaningful traction in the wake of concerns over slowing economic growth in China. It is worth recalling that data released on Monday showed that the economic growth in China decelerated substantially in the second quarter and Retail sales – a gauge of consumption – slowed sharply in June. This, in turn, is seen as a key factor weighing on the China-proxy Aussie, though the possibility of more stimulus measures from China could limit losses for the AUD/USD pair.
The National Development and Reform Commission (NDRC) – China’s top economic planner – pledged that it would roll out policies to restore and expand consumption without delay as consumers’ purchasing power remained weak. Apart from this, the bearish sentiment surrounding the US Dollar (USD) warrants some caution before placing aggressive bearish bets around the AUD/USD pair. In fact, the USD Index (DXY), which tracks the Greenback against a basket of currencies, languishes near its lowest level since April 2022 in the wake of expectations of a less hawkish Federal Reserve (Fed).
Market participants seem convinced that the US central bank will end its policy-tightening campaign and keep interest rates steady for the rest of the year following the largely priced-in 25 bps lift-off in July. This, in turn, keeps the USD bulls on the defensive and makes it prudent to wait for strong follow-through selling to confirm that the AUD/USD pair has formed a bearish double-top pattern near the 0.6900 mark. Market participants now look forward to the US economic docket – featuring the release of monthly Retail Sales and Industrial Production figures – for short-term trading opportunities.
Technical Levels: Supports and Resistances
AUDUSD currently trading at 0.6811 at the time of writing. Pair opened at 0.6816 and is trading with a change of -0.07 % .
| Overview | Overview.1 | |
|---|---|---|
| 0 | Today last price | 0.6811 |
| 1 | Today Daily Change | -0.0005 |
| 2 | Today Daily Change % | -0.0700 |
| 3 | Today daily open | 0.6816 |
The pair remains strongly bullish on the daily timeframe. It trades above its 20 SMA @ 0.6714, 50 SMA 0.6687, 100 SMA @ 0.6686 and 200 SMA @ 0.6708.
| Trends | Trends.1 | |
|---|---|---|
| 0 | Daily SMA20 | 0.6714 |
| 1 | Daily SMA50 | 0.6687 |
| 2 | Daily SMA100 | 0.6686 |
| 3 | Daily SMA200 | 0.6708 |
The previous day high was 0.6854 while the previous day low was 0.6788. The daily 38.2% Fib levels comes at 0.6813, expected to provide resistance. Similarly, the daily 61.8% fib level is at 0.6829, expected to provide resistance.
Note the levels of interest below:
- Pivot support is noted at 0.6785, 0.6753, 0.6718
- Pivot resistance is noted at 0.6851, 0.6885, 0.6917
| Levels | Levels.1 |
|---|---|
| Previous Daily High | 0.6854 |
| Previous Daily Low | 0.6788 |
| Previous Weekly High | 0.6895 |
| Previous Weekly Low | 0.6624 |
| Previous Monthly High | 0.6900 |
| Previous Monthly Low | 0.6484 |
| Daily Fibonacci 38.2% | 0.6813 |
| Daily Fibonacci 61.8% | 0.6829 |
| Daily Pivot Point S1 | 0.6785 |
| Daily Pivot Point S2 | 0.6753 |
| Daily Pivot Point S3 | 0.6718 |
| Daily Pivot Point R1 | 0.6851 |
| Daily Pivot Point R2 | 0.6885 |
| Daily Pivot Point R3 | 0.6917 |
[/s2If]
Download Nehcap EAWe have two EAs that are operational on our LIVE accounts.
- EA-FIX: Check out the details here. Download EA-FIX . EA-FIX is a non-grid HFT scalper.
- EA-GROWTH: High quality low dd EA using trend grids. Download EA_GROWTHJoin Our Telegram Group
")


