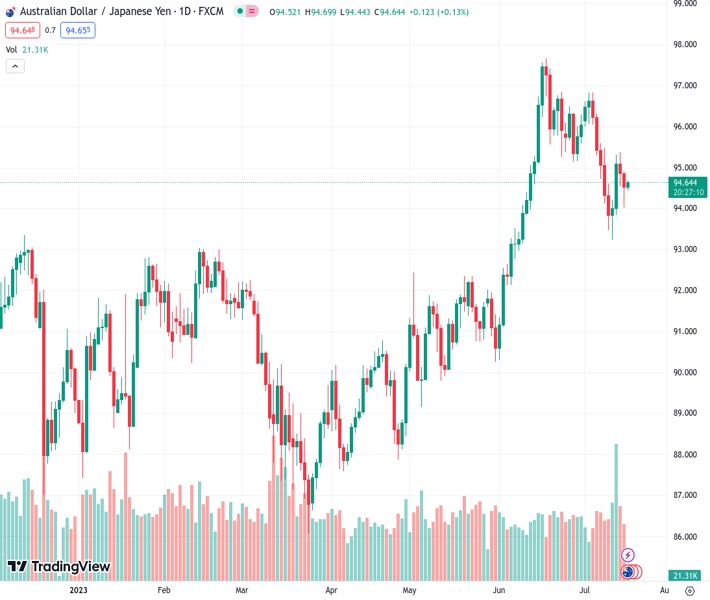
The AUDJPY pair is still facing pressure and trading near the 94.50 level.
…
This is a premium post.
[s2If !current_user_can(access_s2member_level4)]Please register for FREE REGISTER to read full post below containing analysis. In case of any error or you think you are not able to read the full post below, please email us at support#nehcap.com [lwa][/s2If] [s2If current_user_can(access_s2member_level1)]
- AUD/JPY remains on the defensive around the 94.50 mark.
The pair currently trades last at 94.6530.
The previous day high was 95.18 while the previous day low was 94.02. The daily 38.2% Fib levels comes at 94.46, expected to provide support. Similarly, the daily 61.8% fib level is at 94.73, expected to provide resistance.
The AUD/JPY pair struggles to gain any meaningful traction on Tuesday and remains on the defensive around 94.50 in the early Asian session.
From the technical perspective, AUD/JPY trades below a downward-sloping channel on the four-hour chart. The Relative Strength Index (RSI) holds between 40-60, reinforcing the non-directional movement for the AUD/JPY pair.
The immediate resistance level is seen at 94.80, portraying the 50-hour Exponential Moving Average (EMA). The cross will meet the crucial barrier near 95.00. This level is a confluence of a psychological mark, 100-hour EMA and the upper boundary of the descending channel.
The break above the latter could see the cross test 95.40 (High of July 14), followed by 96.15 (High of July 23). The additional upside filter to watch is 96.50 (High of July 27).
On the downside, the 94.00 area acts as a key support level for the cross, representing a psychological level and a low of July 17. Any meaningful follow-through selling will drop to 93.30 (Low of July 12) en route to 92.60 (the lower limit of the descending channel).
Technical Levels: Supports and Resistances
AUDJPY currently trading at 94.62 at the time of writing. Pair opened at 94.55 and is trading with a change of 0.07 % .
| Overview | Overview.1 | |
|---|---|---|
| 0 | Today last price | 94.62 |
| 1 | Today Daily Change | 0.07 |
| 2 | Today Daily Change % | 0.07 |
| 3 | Today daily open | 94.55 |
The pair is trading below its 20 Daily moving average @ 95.57, above its 50 Daily moving average @ 93.77 , above its 100 Daily moving average @ 91.62 and above its 200 Daily moving average @ 91.86
| Trends | Trends.1 | |
|---|---|---|
| 0 | Daily SMA20 | 95.57 |
| 1 | Daily SMA50 | 93.77 |
| 2 | Daily SMA100 | 91.62 |
| 3 | Daily SMA200 | 91.86 |
The previous day high was 95.18 while the previous day low was 94.02. The daily 38.2% Fib levels comes at 94.46, expected to provide support. Similarly, the daily 61.8% fib level is at 94.73, expected to provide resistance.
Note the levels of interest below:
- Pivot support is noted at 93.99, 93.43, 92.84
- Pivot resistance is noted at 95.14, 95.74, 96.3
| Levels | Levels.1 |
|---|---|
| Previous Daily High | 95.18 |
| Previous Daily Low | 94.02 |
| Previous Weekly High | 95.48 |
| Previous Weekly Low | 93.27 |
| Previous Monthly High | 97.68 |
| Previous Monthly Low | 90.30 |
| Daily Fibonacci 38.2% | 94.46 |
| Daily Fibonacci 61.8% | 94.73 |
| Daily Pivot Point S1 | 93.99 |
| Daily Pivot Point S2 | 93.43 |
| Daily Pivot Point S3 | 92.84 |
| Daily Pivot Point R1 | 95.14 |
| Daily Pivot Point R2 | 95.74 |
| Daily Pivot Point R3 | 96.30 |
[/s2If]
Download Nehcap EAWe have two EAs that are operational on our LIVE accounts.
- EA-FIX: Check out the details here. Download EA-FIX . EA-FIX is a non-grid HFT scalper.
- EA-GROWTH: High quality low dd EA using trend grids. Download EA_GROWTHJoin Our Telegram Group
")


