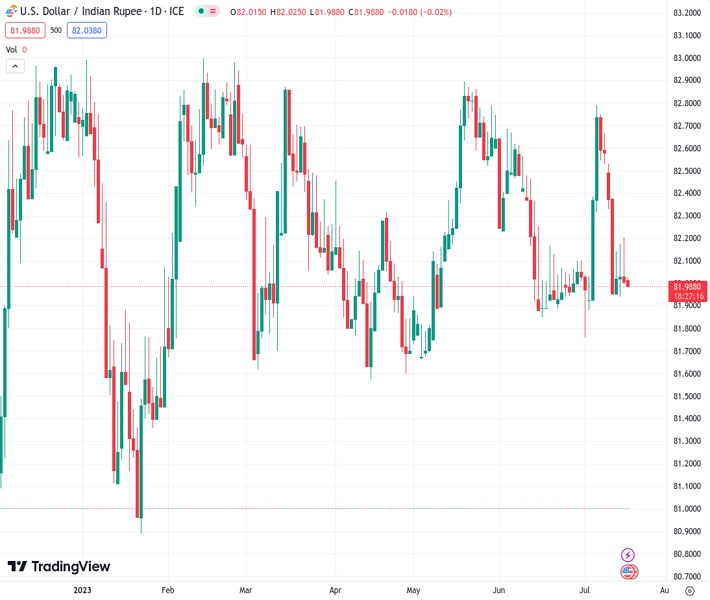
On Tuesday, the exchange rate between the US dollar and Indian rupee, which is marked at 82.0000, stays within a small range of trading surrounding the 82.00 level.
…
This is a premium post.
[s2If !current_user_can(access_s2member_level4)]Please register for FREE REGISTER to read full post below containing analysis. In case of any error or you think you are not able to read the full post below, please email us at support#nehcap.com [lwa][/s2If] [s2If current_user_can(access_s2member_level1)]
- USD/INR remains confined in a narrow trading band around the 82.00 mark on Tuesday.
The pair currently trades last at 82.0000.
The previous day high was 82.2014 while the previous day low was 81.9966. The daily 38.2% Fib levels comes at 82.0748, expected to provide resistance. Similarly, the daily 61.8% fib level is at 82.1231, expected to provide resistance.
The USD/INR pair edges lower for the second successive day on Tuesday, albeit lacks follow-through selling and remains confined in a familiar multi-day-old trading range. Spot prices currently trade around the 82.00 round figure, with bears now awaiting a sustained breakdown through upward-sloping trend-line support extending from November 2022.
Against the backdrop of the recent repeated failures ahead of the 83.00 mark, acceptance back below a technically significant 200-day Simple Moving Average could be seen as a fresh trigger for bearish traders. Moreover, oscillators on the daily chart have again started drifting in the negative territory and suggest that the path of least resistance for the USD/INR pair is to the downside.
That said, it will still be prudent to wait for some follow-through selling below the monthly low, around the 81.75 region, before traders start positioning for any further depreciating move. The USD/INR pair might then accelerate the slide towards the next relevant support near the 81.50 zone before eventually dropping to test sub-81.00 levels or the YTD low touched in January.
On the flip side, the 82.20 area (200-day SMA) now seems to act as an immediate resistance. A sustained strength beyond will reinforce the ascending trend-line support and the subsequent move up has the potential to lift the USD/INR pair beyond the 82.70-82.75 intermediate hurdle. Bullish traders might then make a fresh attempt to conquer the 83.00 round-figure mark.
The said handle has been acting as a strong barrier since October 2022, which if cleared will mark a fresh bullish breakout and set the stage for an extension of the USD/INR pair’s well-established uptrend witnessed since August 2022. Spot prices might then surpass the all-time peak, around the 83.40-83.45 region touched in October 2023, and aim to reclaim the 84.00 mark.
Technical Levels: Supports and Resistances
USDINR currently trading at 82.0334 at the time of writing. Pair opened at 82.0623 and is trading with a change of -0.04 % .
| Overview | Overview.1 | |
|---|---|---|
| 0 | Today last price | 82.0334 |
| 1 | Today Daily Change | -0.0289 |
| 2 | Today Daily Change % | -0.0400 |
| 3 | Today daily open | 82.0623 |
The pair remains strongly bearish on the daily time frame. It trades below the 20 SMA @ 82.1524, 50 SMA 82.3105, 100 SMA @ 82.2009 and 200 SMA @ 82.1774.
| Trends | Trends.1 | |
|---|---|---|
| 0 | Daily SMA20 | 82.1524 |
| 1 | Daily SMA50 | 82.3105 |
| 2 | Daily SMA100 | 82.2009 |
| 3 | Daily SMA200 | 82.1774 |
The previous day high was 82.2014 while the previous day low was 81.9966. The daily 38.2% Fib levels comes at 82.0748, expected to provide resistance. Similarly, the daily 61.8% fib level is at 82.1231, expected to provide resistance.
Note the levels of interest below:
- Pivot support is noted at 81.9721, 81.8819, 81.7672
- Pivot resistance is noted at 82.1769, 82.2916, 82.3818
| Levels | Levels.1 |
|---|---|
| Previous Daily High | 82.2014 |
| Previous Daily Low | 81.9966 |
| Previous Weekly High | 82.7256 |
| Previous Weekly Low | 81.9215 |
| Previous Monthly High | 82.7370 |
| Previous Monthly Low | 81.8477 |
| Daily Fibonacci 38.2% | 82.0748 |
| Daily Fibonacci 61.8% | 82.1231 |
| Daily Pivot Point S1 | 81.9721 |
| Daily Pivot Point S2 | 81.8819 |
| Daily Pivot Point S3 | 81.7672 |
| Daily Pivot Point R1 | 82.1769 |
| Daily Pivot Point R2 | 82.2916 |
| Daily Pivot Point R3 | 82.3818 |
[/s2If]
Download Nehcap EAWe have two EAs that are operational on our LIVE accounts.
- EA-FIX: Check out the details here. Download EA-FIX . EA-FIX is a non-grid HFT scalper.
- EA-GROWTH: High quality low dd EA using trend grids. Download EA_GROWTHJoin Our Telegram Group
")


