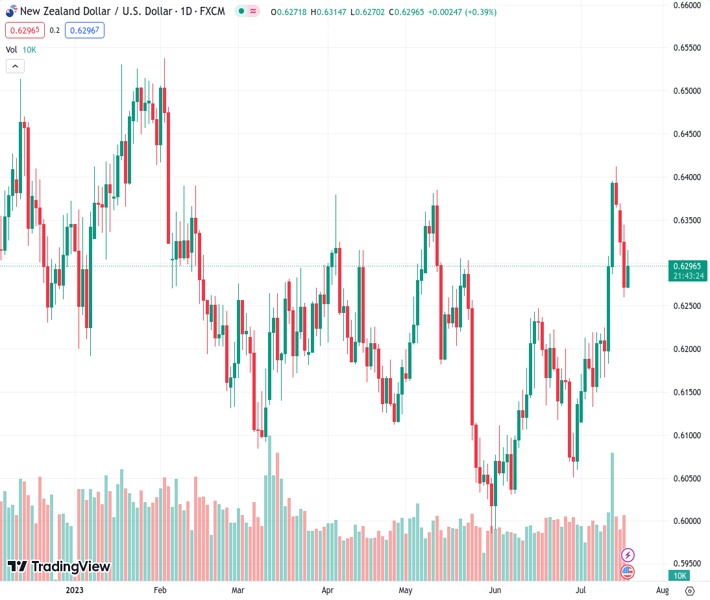
#NZDUSD rallies above 0.6300 as it garners interest from buyers after the release of positive New Zealand data.
…
This is a premium post.
[s2If !current_user_can(access_s2member_level4)]Please register for FREE REGISTER to read full post below containing analysis. In case of any error or you think you are not able to read the full post below, please email us at support#nehcap.com [lwa][/s2If] [s2If current_user_can(access_s2member_level1)]
- NZD/USD attracts some buying and soars above 0.6300 following the New Zealand data.
The pair currently trades last at 0.63017.
The previous day high was 0.637 while the previous day low was 0.6308. The daily 38.2% Fib levels comes at 0.6332, expected to provide resistance. Similarly, the daily 61.8% fib level is at 0.6346, expected to provide resistance.
The NZD/USD pair attracts some buying during the Asian session on Tuesday and edges higher near 0.6285. The uptick in the major pair is backed by the weakening US Dollar broadly and the latest New Zealand Consumer Price Index (CPI) figure.
The US Federal Reserve reported on Tuesday that Industrial Production fell 0.5% in June for the second consecutive month. This figure was lower than the market expected of no change. Meanwhile, Retail Sales increased 0.2% MoM from June to $689.5 billion, according to figures released by the US Census Bureau. This report came in below the market consensus of a 0.5% gain. On the other hand, the 0.3% figure reported in May got revised higher to 0.5%. The US Dollar Index (DXY) initially dropped to a 15-month low following the mixed data before bouncing off near the 99.55 area.
Market players anticipate that the Federal Reserve (Fed) is nearing the end of its policy tightening cycle and will maintain interest rates following the widely anticipated 25 basis points (bps) in the July meeting. This, in turn, leads to the prevailing selling of the US Dollar (USD).
On the New Zealand Dollar front, the latest data by Statistics New Zealand revealed on Wednesday that the Consumer Price Index (CPI) QoQ rose 1.1% against the prior release of 1.2% and better than the expectation of 1%. The annualized CPI rose by 6%, above the market estimate of 5.9% versus 6.7% prior. This data is likely to influence the RBNZ’s interest rate decision, which has an impact on the NZD’s valuation.
On the other hand, the softer Chinese Gross Domestic Product (GDP) in the second quarter has worried investors about the economy’s prospects. It is worth noting that New Zealand is one of China’s major trading partners, and China’s disappointing growth prospects have an impact on the Kiwi.
Moving on, eyes will be on US Housing Starts later in the day and Unemployment Claims on Thursday. The Fed has entered its blackout period ahead of the July 25–26 meeting. Investors will digest the data and find a clear NZD/USD pair direction.
Technical Levels: Supports and Resistances
NZDUSD currently trading at 0.631 at the time of writing. Pair opened at 0.6324 and is trading with a change of -0.22 % .
| Overview | Overview.1 | |
|---|---|---|
| 0 | Today last price | 0.6310 |
| 1 | Today Daily Change | -0.0014 |
| 2 | Today Daily Change % | -0.2200 |
| 3 | Today daily open | 0.6324 |
The pair remains strongly bullish on the daily timeframe. It trades above its 20 SMA @ 0.6196, 50 SMA 0.6175, 100 SMA @ 0.6194 and 200 SMA @ 0.6193.
| Trends | Trends.1 | |
|---|---|---|
| 0 | Daily SMA20 | 0.6196 |
| 1 | Daily SMA50 | 0.6175 |
| 2 | Daily SMA100 | 0.6194 |
| 3 | Daily SMA200 | 0.6193 |
The previous day high was 0.637 while the previous day low was 0.6308. The daily 38.2% Fib levels comes at 0.6332, expected to provide resistance. Similarly, the daily 61.8% fib level is at 0.6346, expected to provide resistance.
Note the levels of interest below:
- Pivot support is noted at 0.6298, 0.6272, 0.6236
- Pivot resistance is noted at 0.636, 0.6396, 0.6422
| Levels | Levels.1 |
|---|---|
| Previous Daily High | 0.6370 |
| Previous Daily Low | 0.6308 |
| Previous Weekly High | 0.6413 |
| Previous Weekly Low | 0.6166 |
| Previous Monthly High | 0.6250 |
| Previous Monthly Low | 0.5990 |
| Daily Fibonacci 38.2% | 0.6332 |
| Daily Fibonacci 61.8% | 0.6346 |
| Daily Pivot Point S1 | 0.6298 |
| Daily Pivot Point S2 | 0.6272 |
| Daily Pivot Point S3 | 0.6236 |
| Daily Pivot Point R1 | 0.6360 |
| Daily Pivot Point R2 | 0.6396 |
| Daily Pivot Point R3 | 0.6422 |
[/s2If]
Download Nehcap EAWe have two EAs that are operational on our LIVE accounts.
- EA-FIX: Check out the details here. Download EA-FIX . EA-FIX is a non-grid HFT scalper.
- EA-GROWTH: High quality low dd EA using trend grids. Download EA_GROWTHJoin Our Telegram Group
")


