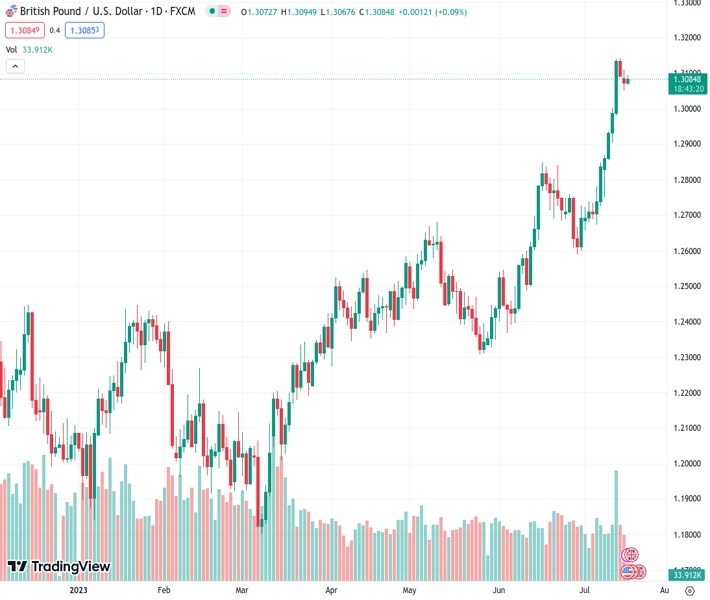
During the Asian trading session on Tuesday, the GBPUSD currency pair rose slightly to a level of 1.30859 but did not continue its upward movement.
…
This is a premium post.
[s2If !current_user_can(access_s2member_level4)]Please register for FREE REGISTER to read full post below containing analysis. In case of any error or you think you are not able to read the full post below, please email us at support#nehcap.com [lwa][/s2If] [s2If current_user_can(access_s2member_level1)]
- GBP/USD edges higher during the Asian session on Tuesday, albeit lacks follow-through.
The pair currently trades last at 1.30859.
The previous day high was 1.3109 while the previous day low was 1.3051. The daily 38.2% Fib levels comes at 1.3073, expected to provide support. Similarly, the daily 61.8% fib level is at 1.3087, expected to provide resistance.
The GBP/USD pair attracts some dip-buying during the Asian session on Tuesday and for now, seems to have stalled a two-day-old corrective slide from its highest level since April 2022, around the 1.3140 region touched last week. Spot prices, however, struggle to capitalize on the move and retreat a few pips from the vicinity of the 1.3100 mark, or a fresh daily peak touched in the last hour.
Bets that the Federal Reserve (Fed) will soften its hawkish tone and keep interest rates steady after the widely anticipated 25 bps lift-off in July continues to act as a headwind for the US Dollar (USD). Apart from this, a positive risk tone is seen as another factor undermining the safe-haven Greenback, which, in turn, assists the GBP/USD pair to regain positive traction. That said, speculations that the US central bank could stick to its forecast for a 50 bps rate hike this year hold back traders from placing fresh bearish bets around the USD and keep a lid on any meaningful upside for the major.
The downside for the GBP/USD pair, however, remains cushioned in the wake of firming expectations that the Bank of England (BoE) will be far more aggressive in tightening its monetary policy to curb stubbornly high inflation. Hence, the market focus will remain glued to the latest consumer inflation figures from the UK, due for release on Wednesday. The crucial CPI report should influence the British Pound (GBP) and provide some meaningful impetus to the major. In the meantime, the US monthly Retail Sales data will be looked upon for short-term trading opportunities on Tuesday.
From a technical perspective, last week’s sustained breakout through a resistance marked by the top end of a nearly one-month-old ascending channel was seen as a fresh trigger for bullish traders. That said, the Relative Strength Index (RSI) on the daily chart is flashing slightly overbought conditions and capping gains for the GBP/USD pair. Nevertheless, the aforementioned fundamental backdrop seems tilted in favour of bullish traders and suggests that the path of least resistance for spot prices is to the upside. This, in turn, suggests that any meaningful pullback might still be seen as a buying opportunity.
The overnight low, around the 1.3050 area, now seems to act as immediate support. This is followed by the 1.3000 psychological mark, which if broken decisively could prompt some technical selling. The GBP/USD pair might then accelerate the slide towards the next relevant support near the 1.2930 horizontal zone, though any subsequent fall is more likely to get bought into near the 1.2900 round figure. This should help limit any further losses for spot prices near the 1.2850 horizontal resistance breakpoint. The latter should act as a strong base for the major and a key pivotal point for short-term traders.
On the flip side, bulls might now wait for a sustained strength back above the 1.3100 mark before positioning for any meaningful intraday appreciating move. The momentum might then lift the GBP/USD pair back towards the 1.3140 region, or the multi-month peak. Some follow-through buying should pave the way for a move towards reclaiming the 1.3200 mark. The upward trajectory could get extended towards the 1.3250-1.3260 intermediate hurdle, above which spot prices seem poised to climb further towards the 1.3300 mark.
Technical Levels: Supports and Resistances
GBPUSD currently trading at 1.3082 at the time of writing. Pair opened at 1.3073 and is trading with a change of 0.07 % .
| Overview | Overview.1 | |
|---|---|---|
| 0 | Today last price | 1.3082 |
| 1 | Today Daily Change | 0.0009 |
| 2 | Today Daily Change % | 0.0700 |
| 3 | Today daily open | 1.3073 |
The pair remains strongly bullish on the daily timeframe. It trades above its 20 SMA @ 1.2809, 50 SMA 1.2629, 100 SMA @ 1.2471 and 200 SMA @ 1.2211.
| Trends | Trends.1 | |
|---|---|---|
| 0 | Daily SMA20 | 1.2809 |
| 1 | Daily SMA50 | 1.2629 |
| 2 | Daily SMA100 | 1.2471 |
| 3 | Daily SMA200 | 1.2211 |
The previous day high was 1.3109 while the previous day low was 1.3051. The daily 38.2% Fib levels comes at 1.3073, expected to provide support. Similarly, the daily 61.8% fib level is at 1.3087, expected to provide resistance.
Note the levels of interest below:
- Pivot support is noted at 1.3046, 1.302, 1.2988
- Pivot resistance is noted at 1.3105, 1.3136, 1.3163
| Levels | Levels.1 |
|---|---|
| Previous Daily High | 1.3109 |
| Previous Daily Low | 1.3051 |
| Previous Weekly High | 1.3142 |
| Previous Weekly Low | 1.2750 |
| Previous Monthly High | 1.2848 |
| Previous Monthly Low | 1.2369 |
| Daily Fibonacci 38.2% | 1.3073 |
| Daily Fibonacci 61.8% | 1.3087 |
| Daily Pivot Point S1 | 1.3046 |
| Daily Pivot Point S2 | 1.3020 |
| Daily Pivot Point S3 | 1.2988 |
| Daily Pivot Point R1 | 1.3105 |
| Daily Pivot Point R2 | 1.3136 |
| Daily Pivot Point R3 | 1.3163 |
[/s2If]
Download Nehcap EAWe have two EAs that are operational on our LIVE accounts.
- EA-FIX: Check out the details here. Download EA-FIX . EA-FIX is a non-grid HFT scalper.
- EA-GROWTH: High quality low dd EA using trend grids. Download EA_GROWTHJoin Our Telegram Group
")


