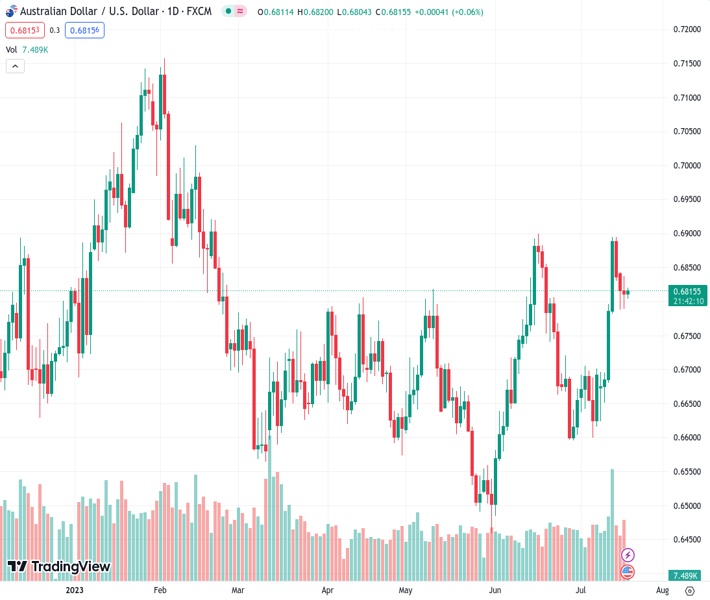
Despite struggling to attract buyers recently, the AUDUSD pair at 0.68141 has managed to break its three-day downtrend.
…
This is a premium post.
[s2If !current_user_can(access_s2member_level4)]Please register for FREE REGISTER to read full post below containing analysis. In case of any error or you think you are not able to read the full post below, please email us at support#nehcap.com [lwa][/s2If] [s2If current_user_can(access_s2member_level1)]
- AUD/USD snaps three-day downtrend despite struggling to pick-up bids of late.
The pair currently trades last at 0.68141.
The previous day high was 0.6854 while the previous day low was 0.6788. The daily 38.2% Fib levels comes at 0.6813, expected to provide support. Similarly, the daily 61.8% fib level is at 0.6829, expected to provide resistance.
AUD/USD edges higher past 0.6800, close to 0.6815 during the early hours of Wednesday’s Asian session, as market players remain optimistic amid receding fears of higher rates and the upbeat performance of the US banks. Also keeping the Aussie pair firmer could be the reassessment of the previous day’s monetary policy meeting minutes from the Reserve Bank of Australia (RBA), as well as headlines surrounding Australia’s biggest customer, namely China.
Market sentiment improves on the positive performance of the US banks, as well as the risk-positive headlines surrounding China, which in turn allowed the Wall Street benchmarks to refresh the yearly top. It’s worth noting, however, that the benchmark US 10-year Treasury bond yields remain pressured around 3.78% while the two-year counterpart edges higher near 4.76% at the latest.
With this, the share prices of the top-tier US banks like Bank of America, Morgan Stanley and Bank of New York Mellon Corp rallied on Tuesday on news that higher interest rates had helped boost profits in the second quarter, shared via Reuters. “Signs of a revival in investment banking, which has been in the doldrums as higher rates and economic uncertainty put a damper on deals and trading, also drove share gains,” said the news.
Talking about China, Washington’s efforts to re-establish ties with Beijing, via multiple diplomatic visits one after the other, join the dragon nation’s rejection of economic fears and hopes of witnessing a 5.0% growth rate in 2023 to underpin optimism about the world’s biggest industrial player. It should be noted that China’s easy prints of the second-quarter (Q2) Gross Domestic Product (GDP) flagged economic fears about the second-largest economy and prod the AUD/USD buyers previously.
Talking about the RBA Minutes, the latest statement stated that the board agreed some further tightening may be required,” adding that “they would reconsider at the August meeting.
On the other hand, US Retail Sales growth for June came in as 0.2% MoM versus 0.5% expected and prior (revised). However, the Retail Sales Control Group marked 0.6% growth versus market forecasts of -0.3% and 0.3% previous readings. It should be noted that the US Industrial Production reprinted -0.5% for June compared to analysts’ estimations of 0.0%.
Amid these plays, Wall Street benchmarks rallied but the US Treasury bond yields edged lower while the US Dollar Index (DXY) initially dropped to a fresh 15-month low before bouncing off 99.56 level, around 99.95 by the press time.
Moving on, the second-tier data from Australia and the US may entertain the AUD/USD pair traders but major attention should be given to the risk catalysts for clear directions.
Despite bouncing off multiple tops marked since early April, surrounding 0.6780-85, the AUD/USD is not out of the woods unless crossing the double tops near the 0.6900 round figure.
Technical Levels: Supports and Resistances
AUDUSD currently trading at 0.6819 at the time of writing. Pair opened at 0.6816 and is trading with a change of 0.04% % .
| Overview | Overview.1 | |
|---|---|---|
| 0 | Today last price | 0.6819 |
| 1 | Today Daily Change | 0.0003 |
| 2 | Today Daily Change % | 0.04% |
| 3 | Today daily open | 0.6816 |
The pair remains strongly bullish on the daily timeframe. It trades above its 20 SMA @ 0.6714, 50 SMA 0.6687, 100 SMA @ 0.6686 and 200 SMA @ 0.6708.
| Trends | Trends.1 | |
|---|---|---|
| 0 | Daily SMA20 | 0.6714 |
| 1 | Daily SMA50 | 0.6687 |
| 2 | Daily SMA100 | 0.6686 |
| 3 | Daily SMA200 | 0.6708 |
The previous day high was 0.6854 while the previous day low was 0.6788. The daily 38.2% Fib levels comes at 0.6813, expected to provide support. Similarly, the daily 61.8% fib level is at 0.6829, expected to provide resistance.
Note the levels of interest below:
- Pivot support is noted at 0.6785, 0.6753, 0.6718
- Pivot resistance is noted at 0.6851, 0.6885, 0.6917
| Levels | Levels.1 |
|---|---|
| Previous Daily High | 0.6854 |
| Previous Daily Low | 0.6788 |
| Previous Weekly High | 0.6895 |
| Previous Weekly Low | 0.6624 |
| Previous Monthly High | 0.6900 |
| Previous Monthly Low | 0.6484 |
| Daily Fibonacci 38.2% | 0.6813 |
| Daily Fibonacci 61.8% | 0.6829 |
| Daily Pivot Point S1 | 0.6785 |
| Daily Pivot Point S2 | 0.6753 |
| Daily Pivot Point S3 | 0.6718 |
| Daily Pivot Point R1 | 0.6851 |
| Daily Pivot Point R2 | 0.6885 |
| Daily Pivot Point R3 | 0.6917 |
[/s2If]
Download Nehcap EAWe have two EAs that are operational on our LIVE accounts.
- EA-FIX: Check out the details here. Download EA-FIX . EA-FIX is a non-grid HFT scalper.
- EA-GROWTH: High quality low dd EA using trend grids. Download EA_GROWTHJoin Our Telegram Group
")


