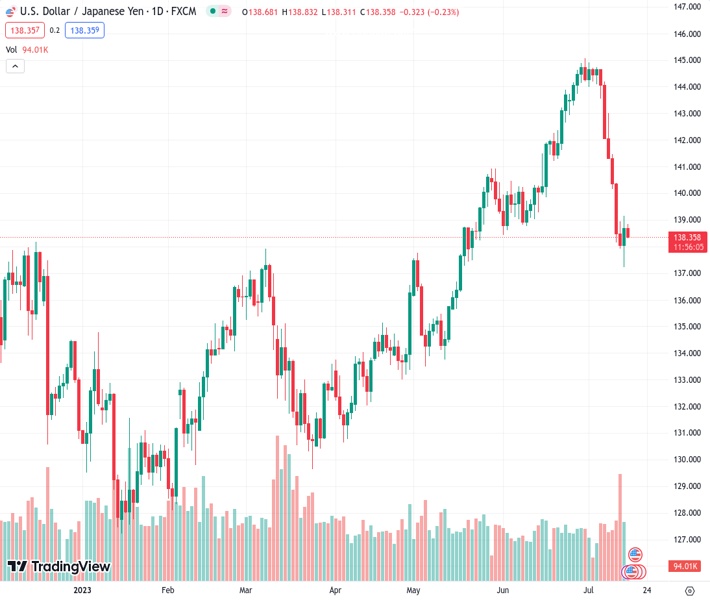
The USDJPY pair, trading at a rate of 138.376, encountered resistance on Monday due to various factors causing downward pressure.
…
This is a premium post.
[s2If !current_user_can(access_s2member_level4)]Please register for FREE REGISTER to read full post below containing analysis. In case of any error or you think you are not able to read the full post below, please email us at support#nehcap.com [lwa][/s2If] [s2If current_user_can(access_s2member_level1)]
- USD/JPY meets with some supply on Monday and is pressured by a combination of factors.
The pair currently trades last at 138.376.
The previous day high was 139.16 while the previous day low was 137.24. The daily 38.2% Fib levels comes at 138.43, expected to provide resistance. Similarly, the daily 61.8% fib level is at 137.97, expected to provide support.
The USD/JPY pair struggles to capitalize on Friday’s goodish rebound from the vicinity of confluence support, comprising the 100-day and the 200-day Simple Moving Averages (SMAs) and edges lower on the first day of a new week. Spot prices remain on the defensive through the early part of the European session and currently trade just below mid-138.00s, down nearly 0.30% for the day.
A weak GDP report from China confirmed that the post-pandemic recovery in the world’s second-largest economy is faltering rapidly due to weakening demand at home and abroad. This, in turn, adds to worries about a global economic downturn and continues to weigh on investors’ sentiment, which, in turn, benefits the safe-haven Japanese Yen (JPY). Moreover, speculations that the Bank of Japan (BoJ) could adjust its Yield Curve Control (YCC) policy as soon as this month further underpin the JPY and exert some downward pressure on the USD/JPY pair.
The recent data showed that Japan’s nominal base salary grew at the fastest pace in 28 years in May. This is expected to push inflation higher, which has exceeded the 2% goal for more than a year. Furthermore, Japanese media reported that the BoJ is likely to raise its FY2023 inflation forecast, fueling speculations that the central bank might start unwinding its ultra-loose monetary policy settings sooner rather than later. The expectations had lifted the yield on the benchmark 10-year Japanese government bond to its highest level since late April last week.
In contrast, market participants now seem convinced that the Federal Reserve (Fed) is nearing the end of its policy tightening cycle and will keep interest rates steady following the widely anticipated 25 bps lift-off in July. This, in turn, prompts fresh selling around the US Dollar (USD), which languishes near its lowest level since April 2022 touched on Friday and contributes to the mildly offered tone surrounding the USD/JPY pair. The aforementioned fundamental backdrop favours bearish traders and suggests that the path of least resistance for spot prices is to the downside.
Market participants now look to the release of the Empire State Manufacturing Index, due later during the early North American session. The data might influence the USD price dynamics and provide some impetus to the USD/JPY pair. Apart from this, the broader risk sentiment should allow traders to grab short-term opportunities.
Technical Levels: Supports and Resistances
USDJPY currently trading at 138.37 at the time of writing. Pair opened at 138.81 and is trading with a change of -0.32 % .
| Overview | Overview.1 | |
|---|---|---|
| 0 | Today last price | 138.37 |
| 1 | Today Daily Change | -0.44 |
| 2 | Today Daily Change % | -0.32 |
| 3 | Today daily open | 138.81 |
The pair is trading below its 20 Daily moving average @ 142.52, below its 50 Daily moving average @ 140.15 , above its 100 Daily moving average @ 137.02 and above its 200 Daily moving average @ 137.09
| Trends | Trends.1 | |
|---|---|---|
| 0 | Daily SMA20 | 142.52 |
| 1 | Daily SMA50 | 140.15 |
| 2 | Daily SMA100 | 137.02 |
| 3 | Daily SMA200 | 137.09 |
The previous day high was 139.16 while the previous day low was 137.24. The daily 38.2% Fib levels comes at 138.43, expected to provide resistance. Similarly, the daily 61.8% fib level is at 137.97, expected to provide support.
Note the levels of interest below:
- Pivot support is noted at 137.65, 136.49, 135.73
- Pivot resistance is noted at 139.57, 140.32, 141.49
| Levels | Levels.1 |
|---|---|
| Previous Daily High | 139.16 |
| Previous Daily Low | 137.24 |
| Previous Weekly High | 143.00 |
| Previous Weekly Low | 137.24 |
| Previous Monthly High | 145.07 |
| Previous Monthly Low | 138.43 |
| Daily Fibonacci 38.2% | 138.43 |
| Daily Fibonacci 61.8% | 137.97 |
| Daily Pivot Point S1 | 137.65 |
| Daily Pivot Point S2 | 136.49 |
| Daily Pivot Point S3 | 135.73 |
| Daily Pivot Point R1 | 139.57 |
| Daily Pivot Point R2 | 140.32 |
| Daily Pivot Point R3 | 141.49 |
[/s2If]
Download Nehcap EAWe have two EAs that are operational on our LIVE accounts.
- EA-FIX: Check out the details here. Download EA-FIX . EA-FIX is a non-grid HFT scalper.
- EA-GROWTH: High quality low dd EA using trend grids. Download EA_GROWTHJoin Our Telegram Group
")


