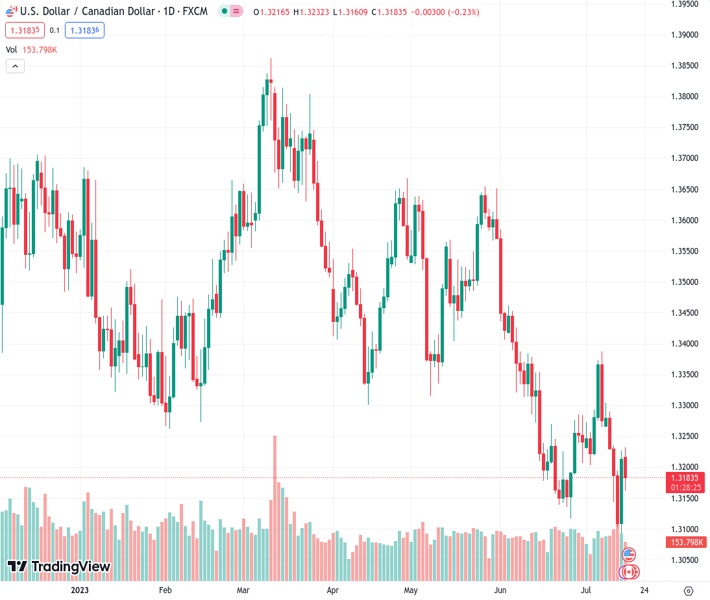
The USDCAD currency pair, which is currently at 1.31835, is expected to drop below 1.3200 due to the strengthening of the Canadian dollar as a result of increased Canadian bond yields.
…
This is a premium post.
[s2If !current_user_can(access_s2member_level4)]Please register for FREE REGISTER to read full post below containing analysis. In case of any error or you think you are not able to read the full post below, please email us at support#nehcap.com [lwa][/s2If] [s2If current_user_can(access_s2member_level1)]
- USD/CAD falls under 1.3200 as Canadian bond yields bolster CAD.
The pair currently trades last at 1.31835.
The previous day high was 1.3227 while the previous day low was 1.3093. The daily 38.2% Fib levels comes at 1.3176, expected to provide support. Similarly, the daily 61.8% fib level is at 1.3144, expected to provide support.
USD/CAD retreats below 1.3200 as the Canadian Dollar (CAD) gets underpinned by high Canadian bond yields, particularly the 10-year note at 3.385%, up 0.53%. In addition, the 20-day Exponential Moving Average (EMA), looming around the 1.3240 mark, was used by USD/CAD sellers to open fresh positions, weakening the pair. Therefore, the USD/CAD is trading at 1.3183, down 0.23%, after hitting a daily high of 1.3232.
From a technical perspective, the USD/CAD is downward biased, but failure to crack below the 1.3100 figure opened the door for recovery. After the USD/CAD printed a yearly low of 1.3092, the USD/CAD rallied towards 1.3220 before trimming some of those gains.
With the Relative Strength Index (RSI) aiming downwards at bearish territory would suggest that sellers remain in charge, except for the three-day Rate of Change (RoC), indicating that neither buyers/sellers are in control.
That said, if USD/CAD stays below 1.3200, first support emerges at 1.3150. A breach of the latter will expose the 1.3100 figure, followed by the year-to-date (YTD) low of 1.3092. Conversely, if USD/CAD buyers reclaim 1.3200, despite printing a bearish candle, that would expose the 20-day EMA at 1.3240. Once cleared, the USD/CAD would rally toward 1.3300, followed by the 50-day EMA at 1.3323, before testing the 200-day EMA at 1.3373.
Technical Levels: Supports and Resistances
USDCAD currently trading at 1.3185 at the time of writing. Pair opened at 1.3217 and is trading with a change of -0.24 % .
| Overview | Overview.1 | |
|---|---|---|
| 0 | Today last price | 1.3185 |
| 1 | Today Daily Change | -0.0032 |
| 2 | Today Daily Change % | -0.2400 |
| 3 | Today daily open | 1.3217 |
The pair remains strongly bearish on the daily time frame. It trades below the 20 SMA @ 1.3223, 50 SMA 1.3358, 100 SMA @ 1.3472 and 200 SMA @ 1.3492.
| Trends | Trends.1 | |
|---|---|---|
| 0 | Daily SMA20 | 1.3223 |
| 1 | Daily SMA50 | 1.3358 |
| 2 | Daily SMA100 | 1.3472 |
| 3 | Daily SMA200 | 1.3492 |
The previous day high was 1.3227 while the previous day low was 1.3093. The daily 38.2% Fib levels comes at 1.3176, expected to provide support. Similarly, the daily 61.8% fib level is at 1.3144, expected to provide support.
Note the levels of interest below:
- Pivot support is noted at 1.3131, 1.3045, 1.2997
- Pivot resistance is noted at 1.3265, 1.3313, 1.3399
| Levels | Levels.1 |
|---|---|
| Previous Daily High | 1.3227 |
| Previous Daily Low | 1.3093 |
| Previous Weekly High | 1.3304 |
| Previous Weekly Low | 1.3093 |
| Previous Monthly High | 1.3585 |
| Previous Monthly Low | 1.3117 |
| Daily Fibonacci 38.2% | 1.3176 |
| Daily Fibonacci 61.8% | 1.3144 |
| Daily Pivot Point S1 | 1.3131 |
| Daily Pivot Point S2 | 1.3045 |
| Daily Pivot Point S3 | 1.2997 |
| Daily Pivot Point R1 | 1.3265 |
| Daily Pivot Point R2 | 1.3313 |
| Daily Pivot Point R3 | 1.3399 |
[/s2If]
Download Nehcap EAWe have two EAs that are operational on our LIVE accounts.
- EA-FIX: Check out the details here. Download EA-FIX . EA-FIX is a non-grid HFT scalper.
- EA-GROWTH: High quality low dd EA using trend grids. Download EA_GROWTHJoin Our Telegram Group
")


