The USDCAD currency pair rises slightly for the second consecutive day, but there is a lack of additional buying to sustain the upward momentum.
…
This is a premium post.
[s2If !current_user_can(access_s2member_level4)]Please register for FREE REGISTER to read full post below containing analysis. In case of any error or you think you are not able to read the full post below, please email us at support#nehcap.com [lwa][/s2If] [s2If current_user_can(access_s2member_level1)]
- USD/CAD edges higher for the second straight day, albeit lacks any follow-through buying.
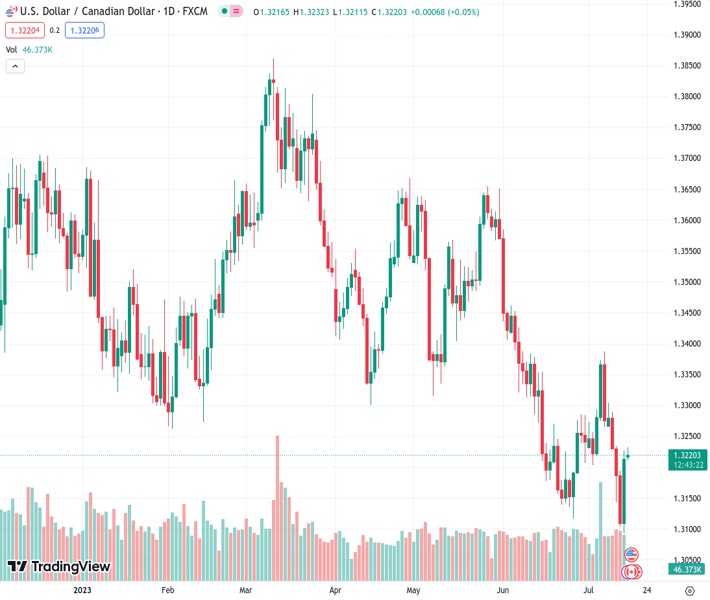
The pair currently trades last at 1.32230.
The previous day high was 1.3227 while the previous day low was 1.3093. The daily 38.2% Fib levels comes at 1.3176, expected to provide support. Similarly, the daily 61.8% fib level is at 1.3144, expected to provide support.
The USD/CAD pair attracts some buying for the second straight day on Monday and trades near the top end of its daily range, around the 1.3220-1.3225 region during the early European session.
China’s second-quarter GDP print falls short of market expectations and raises concerns concern about the fuel demand in the world’s top crude importer. This, along with the resumption of production in Libya, drags Crude Oil prices away from the highest level since April, which, undermines the commodity-linked Loonie and acts as a tailwind for the USD/CAD pair. The upside, however, remains capped in the wake of subdued US Dollar (USD) price action.
From a technical perspective, the USD/CAD pair’s strong recovery from sub-1.3100 levels, or its lowest level since September 2022 stalls near 100-period Simple Moving Average on the 4-hour chart. This is closely followed by the 50% Fibonacci retracement level of the recent downfall witnessed over the past week or so, which if cleared decisively might be seen as a fresh trigger for bullish traders and pave the way for some meaningful intraday appreciating move.
The USD/CAD pair might then climb to test the 61.8% Fibo. level, around the 1.3270 region, before aiming to reclaim the 1.3300 round-figure mark. Some follow-through buying will suggest that spot prices have formed a near-term bottom and set the stage for a move back towards challenging the monthly swing high, around the 1.3385 zone. That said, technical indicators on the daily chart are still holding in the negative territory and warrant caution for bullish traders.
On the flip side, the 1.3200 mark, or the 38.2% Fibo. level now seems to protect the immediate downside, which if broken might expose the 23.6% Fibo., around the 1.3150 area. Some follow-through selling will suggest that the corrective rebound has run its course and make the USD/CAD pair vulnerable to challenge the YTD low, around the 1.3095-1.3090 region.
Technical Levels: Supports and Resistances
USDCAD currently trading at 1.3222 at the time of writing. Pair opened at 1.3217 and is trading with a change of 0.04 % .
| Overview | Overview.1 | |
|---|---|---|
| 0 | Today last price | 1.3222 |
| 1 | Today Daily Change | 0.0005 |
| 2 | Today Daily Change % | 0.0400 |
| 3 | Today daily open | 1.3217 |
The pair remains strongly bearish on the daily time frame. It trades below the 20 SMA @ 1.3223, 50 SMA 1.3358, 100 SMA @ 1.3472 and 200 SMA @ 1.3492.
| Trends | Trends.1 | |
|---|---|---|
| 0 | Daily SMA20 | 1.3223 |
| 1 | Daily SMA50 | 1.3358 |
| 2 | Daily SMA100 | 1.3472 |
| 3 | Daily SMA200 | 1.3492 |
The previous day high was 1.3227 while the previous day low was 1.3093. The daily 38.2% Fib levels comes at 1.3176, expected to provide support. Similarly, the daily 61.8% fib level is at 1.3144, expected to provide support.
Note the levels of interest below:
- Pivot support is noted at 1.3131, 1.3045, 1.2997
- Pivot resistance is noted at 1.3265, 1.3313, 1.3399
| Levels | Levels.1 |
|---|---|
| Previous Daily High | 1.3227 |
| Previous Daily Low | 1.3093 |
| Previous Weekly High | 1.3304 |
| Previous Weekly Low | 1.3093 |
| Previous Monthly High | 1.3585 |
| Previous Monthly Low | 1.3117 |
| Daily Fibonacci 38.2% | 1.3176 |
| Daily Fibonacci 61.8% | 1.3144 |
| Daily Pivot Point S1 | 1.3131 |
| Daily Pivot Point S2 | 1.3045 |
| Daily Pivot Point S3 | 1.2997 |
| Daily Pivot Point R1 | 1.3265 |
| Daily Pivot Point R2 | 1.3313 |
| Daily Pivot Point R3 | 1.3399 |
[/s2If]
Download Nehcap EAWe have two EAs that are operational on our LIVE accounts.
- EA-FIX: Check out the details here. Download EA-FIX . EA-FIX is a non-grid HFT scalper.
- EA-GROWTH: High quality low dd EA using trend grids. Download EA_GROWTHJoin Our Telegram Group
")


