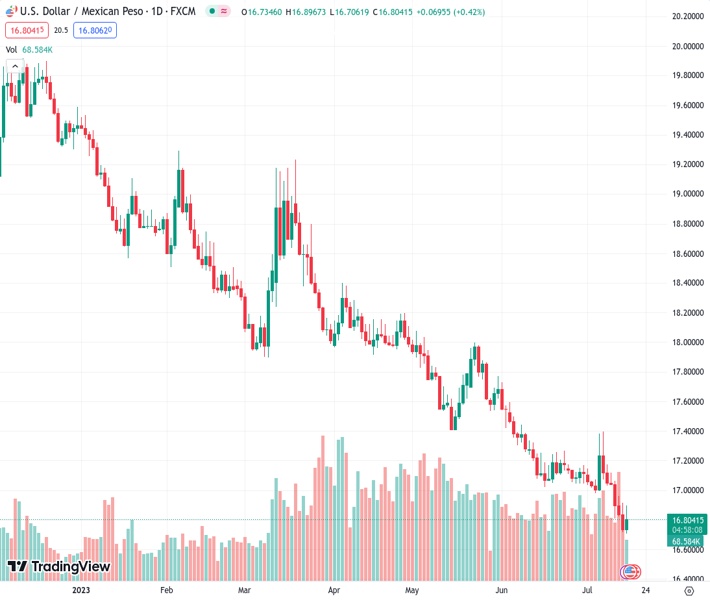
The US dollar to Mexican peso exchange rate, which was at 16.8035, broke its six-day decline and increased by 0.54%. This was influenced by a market sentiment that favored lower-risk investments due to disappointing Chinese GDP and Retail Sales figures.
…
This is a premium post.
[s2If !current_user_can(access_s2member_level4)]Please register for FREE REGISTER to read full post below containing analysis. In case of any error or you think you are not able to read the full post below, please email us at support#nehcap.com [lwa][/s2If] [s2If current_user_can(access_s2member_level1)]
- USD/MXN ends a six-day losing streak, jumps 0.54%, driven by a risk-off market amid weak Chinese GDP and Retail Sales data.
The pair currently trades last at 16.8035.
The previous day high was 16.9188 while the previous day low was 16.7167. The daily 38.2% Fib levels comes at 16.7939, expected to provide support. Similarly, the daily 61.8% fib level is at 16.8416, expected to provide resistance.
USD/MXN snaps six days of losses and climbs from around 7-year lows reached at 16.7062, amid a light economic calendar in Mexico and the United States (US) and a risk-off environment. Weak data from China, namely Gross Domestic Product (GDP) for Q2 and Retail Sales, spurred fears for a global economic slowdown. The USD/MXN is trading at 16.8247, up 0.54%.
Wall Street opened in the green, though it failed to underpin the USD/MXN pair. Data during the Asian session showed that China’s GDP grew 0.8% QoQ, beneath the first quarter (Q1) 2.2%, while on an annual basis, the economy expanded at a 6.3% pace, below 7.1% estimates, but exceeded Q1’s 4.5%. In the meantime, Industrial Production exceeded forecasts, while Retail Sales decelerated sharply from 12.7% in May to 3.1% in June.
Aside from this, the upcoming economic docket in the US will witness the release of Retail Sales on Tuesday, which are expected to rise by 0.5%, above the prior month’s 0.3%. Although the latest Nonfarm Payrolls report disappointed the markets and inflation numbers flash a disinflation process, the latest University of Michigan (UoM) Consumer Sentiment report could be a prelude to a positive retail sales report.
The same day, the US Federal Reserve (Fed), whose speakers entered the blackout period ahead of the upcoming monetary policy meeting on July 25-26, will unveil US Industrial production, estimated at 0% MoM, below May 0.2% expansion.
On the Mexican front, the calendar will reveal Retail Sales until Thursday, estimated at 3.5% YoY, below April’s 3.8%. Softer-than-expected readings could show that the economy would need lower interest rates, as the Bank of Mexico (Banxico) raised more than 700 basis points, keeping the TIIE at around 11.25%. It should be said; the disinflationary process is gathering pace, putting on the table, Banxico’s first rate cut by December 2023.
From a technical standpoint, the USD/MXN is set to continue its downtrend, but a correction is on the cards. If USD/MXN reclaims the July 14 daily open at 16.9172, that could form a bullish engulfing candlestick pattern that can lift the pair toward the 20-day Exponential Moving Average (EMA) at 17.0431. Nevertheless, the latter’s confluence with the 2016 yearly low would be difficult resistance to surpass, and if it happens, that could pave the way to retesting May 17 daily low turned resistance at 17.4038. Otherwise, if resistance holds at 17.0000, the USD/MXN could retest the yearly lows, followed by the October 2015 low at 16.3267
Technical Levels: Supports and Resistances
USDMXN currently trading at 16.8209 at the time of writing. Pair opened at 16.7536 and is trading with a change of 0.4 % .
| Overview | Overview.1 | |
|---|---|---|
| 0 | Today last price | 16.8209 |
| 1 | Today Daily Change | 0.0673 |
| 2 | Today Daily Change % | 0.4000 |
| 3 | Today daily open | 16.7536 |
The pair remains strongly bearish on the daily time frame. It trades below the 20 SMA @ 17.0712, 50 SMA 17.353, 100 SMA @ 17.786 and 200 SMA @ 18.5466.
| Trends | Trends.1 | |
|---|---|---|
| 0 | Daily SMA20 | 17.0712 |
| 1 | Daily SMA50 | 17.3530 |
| 2 | Daily SMA100 | 17.7860 |
| 3 | Daily SMA200 | 18.5466 |
The previous day high was 16.9188 while the previous day low was 16.7167. The daily 38.2% Fib levels comes at 16.7939, expected to provide support. Similarly, the daily 61.8% fib level is at 16.8416, expected to provide resistance.
Note the levels of interest below:
- Pivot support is noted at 16.674, 16.5943, 16.4719
- Pivot resistance is noted at 16.876, 16.9984, 17.0781
| Levels | Levels.1 |
|---|---|
| Previous Daily High | 16.9188 |
| Previous Daily Low | 16.7167 |
| Previous Weekly High | 17.1746 |
| Previous Weekly Low | 16.7167 |
| Previous Monthly High | 17.7286 |
| Previous Monthly Low | 17.0243 |
| Daily Fibonacci 38.2% | 16.7939 |
| Daily Fibonacci 61.8% | 16.8416 |
| Daily Pivot Point S1 | 16.6740 |
| Daily Pivot Point S2 | 16.5943 |
| Daily Pivot Point S3 | 16.4719 |
| Daily Pivot Point R1 | 16.8760 |
| Daily Pivot Point R2 | 16.9984 |
| Daily Pivot Point R3 | 17.0781 |
[/s2If]
Download Nehcap EAWe have two EAs that are operational on our LIVE accounts.
- EA-FIX: Check out the details here. Download EA-FIX . EA-FIX is a non-grid HFT scalper.
- EA-GROWTH: High quality low dd EA using trend grids. Download EA_GROWTHJoin Our Telegram Group
")


