The price of silver, currently at $24.844 per ounce, is having difficulty maintaining its upward momentum above a key level of resistance that has now become a support level. An expert’s prediction is that a temporary decline in price is anticipated.
…
This is a premium post.
[s2If !current_user_can(access_s2member_level4)]Please register for FREE REGISTER to read full post below containing analysis. In case of any error or you think you are not able to read the full post below, please email us at support#nehcap.com [lwa][/s2If] [s2If current_user_can(access_s2member_level1)]
- Silver Price struggles to defend upside break of yearly horizontal resistance-turned-support.
The pair currently trades last at 24.844.
The previous day high was 25.02 while the previous day low was 24.68. The daily 38.2% Fib levels comes at 24.89, expected to provide resistance. Similarly, the daily 61.8% fib level is at 24.81, expected to provide support.
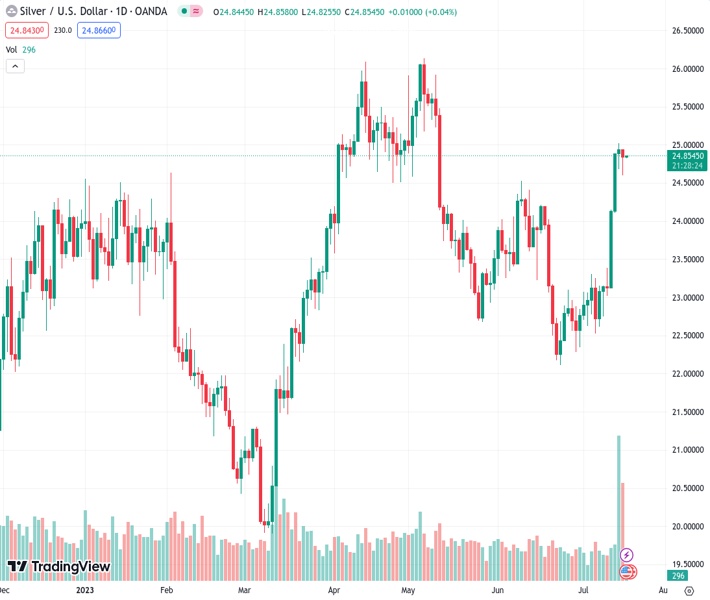
Silver Price (XAG/USD) stays defensive around $24.85-90 during early Tuesday in Asia, fading the previous day’s upside break of a seven-month-old horizontal resistance despite the late Monday’s corrective bounce off $24.50 support.
In doing so, the XAG/USD takes clues from the overbought RSI while also justifying the bear cross on the daily chart to tease the commodity sellers. That said, the 50-SMA pierces off the 100-SMA from above and portrays the “bear cross”, which in turn suggests that the Silver buyers are running out of stem.
It’s worth noting, however, that the bullish MACD signals and the aforementioned key support zone, previous resistance surrounding $24.55-50, challenge the Silver bears from entering.
Following that, a quick fall toward the $24.00 round figure can’t be ruled out. However, a convergence of the 50-SMA and 100-SMA, around $23.60-55, will restrict the XAG/USD’s further downside.
On the flip side, Silver buyers need not only to cross the latest peak of $25.00 but should also remain firmer past the $25.40 hurdle comprising multiple levels marked since early April to retake control.
Even so, the double tops bearish formation around the $26.10-15 region appears a tough nut to crack for the XAGA/USD bulls.
Trend: Pullback expected
Technical Levels: Supports and Resistances
XAGUSD currently trading at 24.85 at the time of writing. Pair opened at 24.94 and is trading with a change of -0.36% % .
| Overview | Overview.1 | |
|---|---|---|
| 0 | Today last price | 24.85 |
| 1 | Today Daily Change | -0.09 |
| 2 | Today Daily Change % | -0.36% |
| 3 | Today daily open | 24.94 |
The pair remains strongly bullish on the daily timeframe. It trades above its 20 SMA @ 23.16, 50 SMA 23.59, 100 SMA @ 23.52 and 200 SMA @ 22.77.
| Trends | Trends.1 | |
|---|---|---|
| 0 | Daily SMA20 | 23.16 |
| 1 | Daily SMA50 | 23.59 |
| 2 | Daily SMA100 | 23.52 |
| 3 | Daily SMA200 | 22.77 |
The previous day high was 25.02 while the previous day low was 24.68. The daily 38.2% Fib levels comes at 24.89, expected to provide resistance. Similarly, the daily 61.8% fib level is at 24.81, expected to provide support.
Note the levels of interest below:
- Pivot support is noted at 24.74, 24.54, 24.39
- Pivot resistance is noted at 25.08, 25.22, 25.42
| Levels | Levels.1 |
|---|---|
| Previous Daily High | 25.02 |
| Previous Daily Low | 24.68 |
| Previous Weekly High | 25.02 |
| Previous Weekly Low | 22.75 |
| Previous Monthly High | 24.53 |
| Previous Monthly Low | 22.11 |
| Daily Fibonacci 38.2% | 24.89 |
| Daily Fibonacci 61.8% | 24.81 |
| Daily Pivot Point S1 | 24.74 |
| Daily Pivot Point S2 | 24.54 |
| Daily Pivot Point S3 | 24.39 |
| Daily Pivot Point R1 | 25.08 |
| Daily Pivot Point R2 | 25.22 |
| Daily Pivot Point R3 | 25.42 |
[/s2If]
Download Nehcap EAWe have two EAs that are operational on our LIVE accounts.
- EA-FIX: Check out the details here. Download EA-FIX . EA-FIX is a non-grid HFT scalper.
- EA-GROWTH: High quality low dd EA using trend grids. Download EA_GROWTHJoin Our Telegram Group
")


