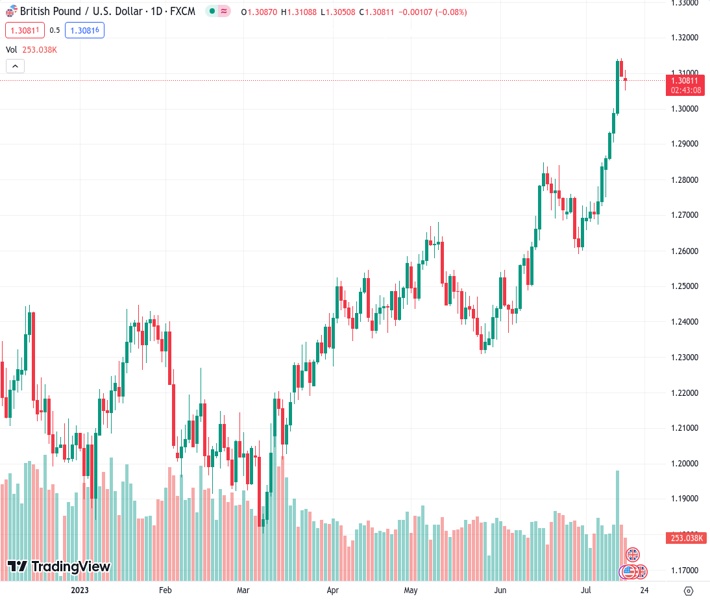
The GBPUSD currency pair experienced a decrease of 0.08% to reach a value of 1.30812, following the release of disappointing Chinese GDP data. This led to a surge in demand for safer investments, causing the exchange rate to fall below 1.3100.
…
This is a premium post.
[s2If !current_user_can(access_s2member_level4)]Please register for FREE REGISTER to read full post below containing analysis. In case of any error or you think you are not able to read the full post below, please email us at support#nehcap.com [lwa][/s2If] [s2If current_user_can(access_s2member_level1)]
- GBP/USD suffers 0.08% drop as disappointing Chinese GDP data sparks flight to safety; exchange rate slips under 1.3100.
The pair currently trades last at 1.30812.
The previous day high was 1.3142 while the previous day low was 1.309. The daily 38.2% Fib levels comes at 1.311, expected to provide resistance. Similarly, the daily 61.8% fib level is at 1.3122, expected to provide resistance.
GBP/USD lost traction during the North American session, falling below the 1.3100 figure due to an adverse market mood spurred by a weaker-than-expected economic recovery in China, which triggered a flight to safe-haven assets. The GBP/USD is trading at 1.3080, down 0.08%.
During the Asian session, China’s Gross Domestic Product (GDP) for the second quarter missed estimates portraying a gloomy economic outlook. Although Industrial Production expanded at a healthy rate, Retail Sales slowed sharply, from May’s 12.7% to 3.1% in June. However, data coming from the UK would greatly influence the pair.
On Wednesday, the UK will reveal the Consumer Price Index (CPI) for June, estimated at 8.2% YoY, from 8.7% in May, while the core CPI is awaited at 7.1%, unchanged from May. Expectations that the Bank of England (BoE) would raise rates by 50 bps in August remained high, with traders seeing the BoE lifting the Bank Rates to 6.25% in early 2024. Nevertheless, recent economic data indicates that the UK’s economy is at the brisk of a recession, which would be more profound, amidst high inflation levels and the BoE tightening monetary conditions.
High inflation numbers would only benefit GBP/USD longs, which could lift the exchange rate past the 2021 yearly low and the 1.3200 figure. As of writing, the US Dollar Index (DXY), a measure of the buck’s value vs. its peers, eases below the 100.000 mark, down by 0.09%, at 99.875.
Aside from this, GBP/USD traders remain laser-focused on the release of Retail Sales on Tuesday, expected to rise by 0.5%, above the prior month’s 0.3%. The latest US Consumer Sentiment report spurred speculations about June’s retail sales report, as consumers remain positive about the economy. Also, the US Federal Reserve (Fed) will unveil US Industrial production, estimated at 0% MoM, below May 0.2% expansion.
The GBP/USD remains upward biased but subject to a mean reversion move, after an overextended rally of twelve days, with the pair gaining almost 4%, though failing to crack the 2021 yearly low of 1.3160. Hence, GBP/USD sellers stepped in, dragging the price below the 1.3100 mark, which, if it holds, the GBP/USD could be headed for further losses. However, the release of important data from the United Kingdom (UK) would keep price action within familiar levels. On the downside, the GBP/USD remains below 1.3100 which could expose the 1.3000 mark, followed by the July 13 daily low of 1.2979.
Technical Levels: Supports and Resistances
GBPUSD currently trading at 1.3082 at the time of writing. Pair opened at 1.3092 and is trading with a change of -0.08 % .
| Overview | Overview.1 | |
|---|---|---|
| 0 | Today last price | 1.3082 |
| 1 | Today Daily Change | -0.0010 |
| 2 | Today Daily Change % | -0.0800 |
| 3 | Today daily open | 1.3092 |
The pair remains strongly bullish on the daily timeframe. It trades above its 20 SMA @ 1.2795, 50 SMA 1.262, 100 SMA @ 1.2461 and 200 SMA @ 1.2201.
| Trends | Trends.1 | |
|---|---|---|
| 0 | Daily SMA20 | 1.2795 |
| 1 | Daily SMA50 | 1.2620 |
| 2 | Daily SMA100 | 1.2461 |
| 3 | Daily SMA200 | 1.2201 |
The previous day high was 1.3142 while the previous day low was 1.309. The daily 38.2% Fib levels comes at 1.311, expected to provide resistance. Similarly, the daily 61.8% fib level is at 1.3122, expected to provide resistance.
Note the levels of interest below:
- Pivot support is noted at 1.3074, 1.3055, 1.3021
- Pivot resistance is noted at 1.3127, 1.3161, 1.3179
| Levels | Levels.1 |
|---|---|
| Previous Daily High | 1.3142 |
| Previous Daily Low | 1.3090 |
| Previous Weekly High | 1.3142 |
| Previous Weekly Low | 1.2750 |
| Previous Monthly High | 1.2848 |
| Previous Monthly Low | 1.2369 |
| Daily Fibonacci 38.2% | 1.3110 |
| Daily Fibonacci 61.8% | 1.3122 |
| Daily Pivot Point S1 | 1.3074 |
| Daily Pivot Point S2 | 1.3055 |
| Daily Pivot Point S3 | 1.3021 |
| Daily Pivot Point R1 | 1.3127 |
| Daily Pivot Point R2 | 1.3161 |
| Daily Pivot Point R3 | 1.3179 |
[/s2If]
Download Nehcap EAWe have two EAs that are operational on our LIVE accounts.
- EA-FIX: Check out the details here. Download EA-FIX . EA-FIX is a non-grid HFT scalper.
- EA-GROWTH: High quality low dd EA using trend grids. Download EA_GROWTHJoin Our Telegram Group
")


