The EUR/USD pair increases slightly as the European Central Bank indicates a more aggressive stance, and the US Dollar weakens.
…
This is a premium post.
[s2If !current_user_can(access_s2member_level4)]Please register for FREE REGISTER to read full post below containing analysis. In case of any error or you think you are not able to read the full post below, please email us at support#nehcap.com [lwa][/s2If] [s2If current_user_can(access_s2member_level1)]
- EUR/USD edges higher amid hawkish ECB signals, US Dollar’s retreat.
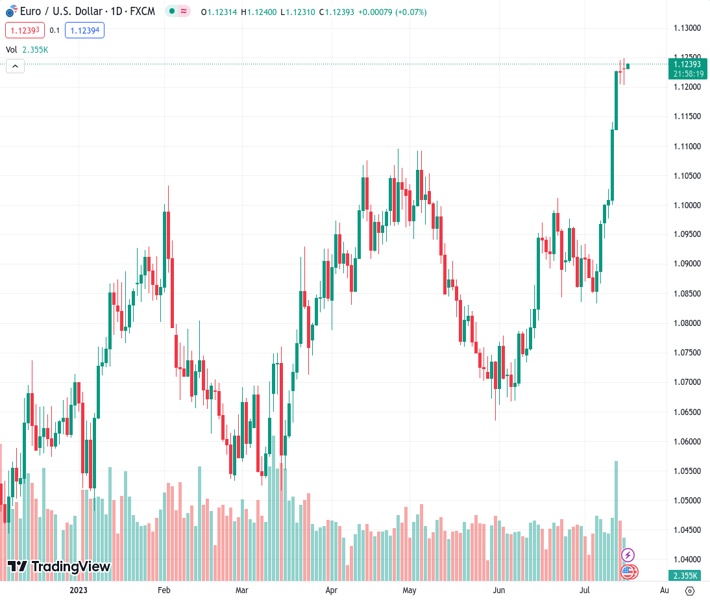
The pair currently trades last at 1.12395.
The previous day high was 1.1245 while the previous day low was 1.1204. The daily 38.2% Fib levels comes at 1.1229, expected to provide support. Similarly, the daily 61.8% fib level is at 1.122, expected to provide support.
EUR/USD bulls keep flirting with the 1.1250 resistance for the third consecutive day amid the early hours of Tuesday’s Asian session, staying around the highest levels since February 2022. In doing so, the Euro pair justifies hawkish bias at the European Central Bank (ECB) while cheering the US Dollar’s retreat. However, a cautious mood ahead of today’s key US Retail Sales for June and a mixed mood in the market seems to prod the major currency pair’s buyers.
On Monday, European Central Bank (ECB) policymaker Boštjan Vasle said, “We need to keep tightening policy at our next meeting.” The policymaker emphasizes the resilient and high core inflation while favoring the hawkish move.
On the same line was ECB policymaker and Bundesbank Chief Joachim Nagel who said “I expect the ECB will raise interest rates later this month by 25 bps” as core inflation in the Eurozone is ‘very sticky’ but “For the September meeting, we will see what the data will tell us.”
It should be noted that the looming fears of Germany’s recession and the recent easing in China’s economic recovery seem to prod the Euro bulls and allow the US Dollar to lick its wounds despite unimpressive data at home.
On Monday, New York (NY) Empire State Manufacturing Index for July eased to 1.1 from 6.6 prior and 0.0 market forecasts. The data failed to inspire the US Dollar Index (DXY) sellers initially before weighing on the DXY, probing Friday’s recovery backed by the upbeat prints of the University of Michigan’s (UoM) Consumer Sentiment Index and consumer inflation expectations for the said month.
Elsewhere, the return of the US-China tension and the market’s consolidation ahead of late July’s Federal Open Market Committee (FOMC) Monetary Policy Meeting also prod the EUR/USD bulls.
Against this backdrop, Wall Street closed with minor gains whereas the US Treasury bond yields remained pressured.
To overcome the inaction around the key upside hurdle, US Retail Sales for June, expected to rise to 0.5% versus 0.3% prior, will be crucial to watch. Also important will be the ECB talks and the US Industrial Production for June, expected -0.1% versus -0.2% prior.
A higher high on prices joins a higher high on the RSI (14) line to validate the latest AUD/USD run-up. However, a clear upside break of the 1.1250 hurdle appears necessary for the Aussie pair buyers to target the February 2022 high of near 1.1495.
That said, the pullback moves appear unimpressive unless the quote stays beyond the previous resistance line stretched from early February, around 1.1160 by the press time.
Technical Levels: Supports and Resistances
EURUSD currently trading at 1.1239 at the time of writing. Pair opened at 1.1227 and is trading with a change of 0.11% % .
| Overview | Overview.1 | |
|---|---|---|
| 0 | Today last price | 1.1239 |
| 1 | Today Daily Change | 0.0012 |
| 2 | Today Daily Change % | 0.11% |
| 3 | Today daily open | 1.1227 |
The pair remains strongly bullish on the daily timeframe. It trades above its 20 SMA @ 1.0966, 50 SMA 1.087, 100 SMA @ 1.0854 and 200 SMA @ 1.0653.
| Trends | Trends.1 | |
|---|---|---|
| 0 | Daily SMA20 | 1.0966 |
| 1 | Daily SMA50 | 1.0870 |
| 2 | Daily SMA100 | 1.0854 |
| 3 | Daily SMA200 | 1.0653 |
The previous day high was 1.1245 while the previous day low was 1.1204. The daily 38.2% Fib levels comes at 1.1229, expected to provide support. Similarly, the daily 61.8% fib level is at 1.122, expected to provide support.
Note the levels of interest below:
- Pivot support is noted at 1.1206, 1.1185, 1.1165
- Pivot resistance is noted at 1.1247, 1.1266, 1.1287
| Levels | Levels.1 |
|---|---|
| Previous Daily High | 1.1245 |
| Previous Daily Low | 1.1204 |
| Previous Weekly High | 1.1245 |
| Previous Weekly Low | 1.0944 |
| Previous Monthly High | 1.1012 |
| Previous Monthly Low | 1.0662 |
| Daily Fibonacci 38.2% | 1.1229 |
| Daily Fibonacci 61.8% | 1.1220 |
| Daily Pivot Point S1 | 1.1206 |
| Daily Pivot Point S2 | 1.1185 |
| Daily Pivot Point S3 | 1.1165 |
| Daily Pivot Point R1 | 1.1247 |
| Daily Pivot Point R2 | 1.1266 |
| Daily Pivot Point R3 | 1.1287 |
[/s2If]
Download Nehcap EAWe have two EAs that are operational on our LIVE accounts.
- EA-FIX: Check out the details here. Download EA-FIX . EA-FIX is a non-grid HFT scalper.
- EA-GROWTH: High quality low dd EA using trend grids. Download EA_GROWTHJoin Our Telegram Group
")


