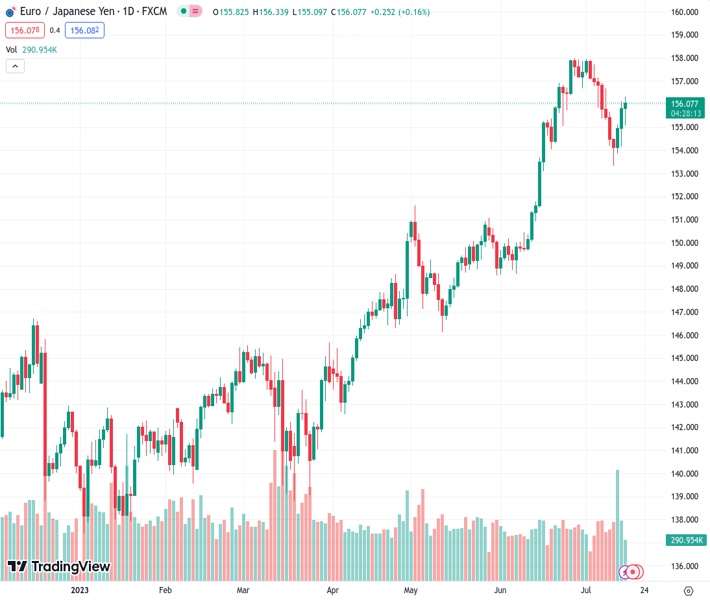
The currency pair EURJPY has been on a three-day winning streak and is currently trading close to the 20-day Simple Moving Average (SMA) at a level of 156.30.
…
This is a premium post.
[s2If !current_user_can(access_s2member_level4)]Please register for FREE REGISTER to read full post below containing analysis. In case of any error or you think you are not able to read the full post below, please email us at support#nehcap.com [lwa][/s2If] [s2If current_user_can(access_s2member_level1)]
- EUR/JPY tallies a three-day winning streak and trades near the 20-day SMA at 156.30.
The pair currently trades last at 156.093.
The previous day high was 156.14 while the previous day low was 154.17. The daily 38.2% Fib levels comes at 155.39, expected to provide support. Similarly, the daily 61.8% fib level is at 154.92, expected to provide support.
At the start of the week, the JPY traded soft against most of its rivals including the USD,EUR and GBP as the Yen lost traction following soft economic data from China. Investors are still modeling their expectations towards the next Bank of Japan (BoJ) decision so Trade Balance data will be closely followed.
China released mixed June Retail Sales and soft Q2 Gross Domestic Product (GDP) figures. GDP came in at 0.8% QoQ, as predicted, compared to 2.2% in Q1, while the annualised pace was 6.3%, below the expected 7.1% and 4.5% in Q1. Retail Sales came in at 3.1% YoY versus 3.3% anticipated in June significantly dropping from the previous figure of 12.7% seen May, while Industrial Production came in at 4.4% YoY beating the 2.5% projected and the previous 3.5% in May. In that sense, as China is Japan’s main trading partner, following the release of the data the JPY weakened as a lower Chinese demand could contribute to Japan’s economy to soften.
That being said, attention is set on the next Bank of Japan (BoJ) decision. The markets speculated recently with a tweak in the bank’s Yield Control Curve (YCC) on the back of rising local wages which favoured the JPY. In addition, investors will keep an eye on any macro forecasts as Bloomberg reported that its likely that the BoJ will update its inflation projections.
On the other hand, the European’s macroecononmic calendar remains scarce this week as attention turns to next week European Central Bank (ECB) decision where markets are expecting a 25 basis points (bps) hike.
According to the daily chart, the downwards momentum is fading out and the bulls are taking the command. The Relative Strength Index (RSI) points north standing above its midline, while the Moving Average Convergence Divergence (MACD) prints decreasing red bars signalling that the bulls are gaining traction.
Resistance Levels: 156.30 (20-day Simple Moving Average), 157.00, 158.00
Support Levels: 156.00, 155.50, 155.00.
Technical Levels: Supports and Resistances
EURJPY currently trading at 156.09 at the time of writing. Pair opened at 155.85 and is trading with a change of 0.15 % .
| Overview | Overview.1 | |
|---|---|---|
| 0 | Today last price | 156.09 |
| 1 | Today Daily Change | 0.24 |
| 2 | Today Daily Change % | 0.15 |
| 3 | Today daily open | 155.85 |
The pair is trading below its 20 Daily moving average @ 156.28, above its 50 Daily moving average @ 152.34 , above its 100 Daily moving average @ 148.72 and above its 200 Daily moving average @ 145.92
| Trends | Trends.1 | |
|---|---|---|
| 0 | Daily SMA20 | 156.28 |
| 1 | Daily SMA50 | 152.34 |
| 2 | Daily SMA100 | 148.72 |
| 3 | Daily SMA200 | 145.92 |
The previous day high was 156.14 while the previous day low was 154.17. The daily 38.2% Fib levels comes at 155.39, expected to provide support. Similarly, the daily 61.8% fib level is at 154.92, expected to provide support.
Note the levels of interest below:
- Pivot support is noted at 154.63, 153.42, 152.67
- Pivot resistance is noted at 156.6, 157.35, 158.57
| Levels | Levels.1 |
|---|---|
| Previous Daily High | 156.14 |
| Previous Daily Low | 154.17 |
| Previous Weekly High | 156.67 |
| Previous Weekly Low | 153.43 |
| Previous Monthly High | 158.00 |
| Previous Monthly Low | 148.62 |
| Daily Fibonacci 38.2% | 155.39 |
| Daily Fibonacci 61.8% | 154.92 |
| Daily Pivot Point S1 | 154.63 |
| Daily Pivot Point S2 | 153.42 |
| Daily Pivot Point S3 | 152.67 |
| Daily Pivot Point R1 | 156.60 |
| Daily Pivot Point R2 | 157.35 |
| Daily Pivot Point R3 | 158.57 |
[/s2If]
Download Nehcap EAWe have two EAs that are operational on our LIVE accounts.
- EA-FIX: Check out the details here. Download EA-FIX . EA-FIX is a non-grid HFT scalper.
- EA-GROWTH: High quality low dd EA using trend grids. Download EA_GROWTHJoin Our Telegram Group
")


