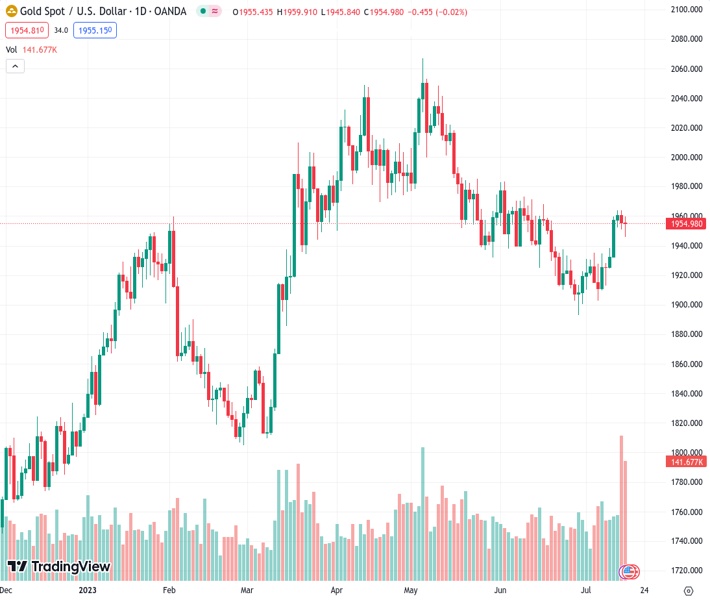
The bull is trying to reclaim the 100-day Simple Moving Average at a price of $1,955 for XAUUSD.
…
This is a premium post.
[s2If !current_user_can(access_s2member_level4)]Please register for FREE REGISTER to read full post below containing analysis. In case of any error or you think you are not able to read the full post below, please email us at support#nehcap.com [lwa][/s2If] [s2If current_user_can(access_s2member_level1)]
- XAU/USD bull’s battle to regain the 100-day SMA at $1,955.
The pair currently trades last at 1955.08.
The previous day high was 1963.82 while the previous day low was 1950.95. The daily 38.2% Fib levels comes at 1955.87, expected to provide resistance. Similarly, the daily 61.8% fib level is at 1958.9, expected to provide resistance.
At the start of the week, the XAU/USD traded in the $1,945 – $1,960 range as the USD fought back and traded resilient at the 99.90 area. However, US Treasury yield continued declining, limiting the Gold’s downside potential.
Retail Sales are expected to have increased by 0.5% in June, while the sales excluding the Automobile sectors have expanded by 0.3%. It’s worth noticing that following soft inflation figures reported last week, signs of the US weakening may take the pressure off the Federal Reserve (Fed) to continue tightening so the US Treasury yields and hence the yellow metal’s price dynamics may see volatility following the data.
As for now, market participants, as per the CME FedWatch Tool, have largely priced in 25 basis points (bps) hike in the next July 26 Fed meeting, but the odds of another hike in 2023 have fallen to 20% due to soft inflation figures. In that sense, these dovish bets on the Fed are responsible for the USD weakness, which allowed the XAU/USD to rally last week.
The daily chart, suggests that the technical outlook for the XAU/USD is neutral to bullish as the bulls show signs of exhaustion. The Relative Strength Index (RSI) stands flat above its midline while the Moving Average Convergence Divergence (MACD) printed a lower green bar, suggesting that the buyers are losing strength.
Supports Levels: $1,945, $1,927 (20-day Simple Moving Average), $1,915.
Resistance Levels: $1,955 (100-day Simple Moving Average), $1,965, $1,990.
Technical Levels: Supports and Resistances
XAUUSD currently trading at 1954.98 at the time of writing. Pair opened at 1955.23 and is trading with a change of -0.01 % .
| Overview | Overview.1 | |
|---|---|---|
| 0 | Today last price | 1954.98 |
| 1 | Today Daily Change | -0.25 |
| 2 | Today Daily Change % | -0.01 |
| 3 | Today daily open | 1955.23 |
The pair remains strongly bullish on the daily timeframe. It trades above its 20 SMA @ 1927.74, 50 SMA 1954.5, 100 SMA @ 1953.64 and 200 SMA @ 1872.41.
| Trends | Trends.1 | |
|---|---|---|
| 0 | Daily SMA20 | 1927.74 |
| 1 | Daily SMA50 | 1954.50 |
| 2 | Daily SMA100 | 1953.64 |
| 3 | Daily SMA200 | 1872.41 |
The previous day high was 1963.82 while the previous day low was 1950.95. The daily 38.2% Fib levels comes at 1955.87, expected to provide resistance. Similarly, the daily 61.8% fib level is at 1958.9, expected to provide resistance.
Note the levels of interest below:
- Pivot support is noted at 1949.51, 1943.8, 1936.64
- Pivot resistance is noted at 1962.38, 1969.54, 1975.25
| Levels | Levels.1 |
|---|---|
| Previous Daily High | 1963.82 |
| Previous Daily Low | 1950.95 |
| Previous Weekly High | 1963.82 |
| Previous Weekly Low | 1912.74 |
| Previous Monthly High | 1983.50 |
| Previous Monthly Low | 1893.01 |
| Daily Fibonacci 38.2% | 1955.87 |
| Daily Fibonacci 61.8% | 1958.90 |
| Daily Pivot Point S1 | 1949.51 |
| Daily Pivot Point S2 | 1943.80 |
| Daily Pivot Point S3 | 1936.64 |
| Daily Pivot Point R1 | 1962.38 |
| Daily Pivot Point R2 | 1969.54 |
| Daily Pivot Point R3 | 1975.25 |
[/s2If]
Download Nehcap EAWe have two EAs that are operational on our LIVE accounts.
- EA-FIX: Check out the details here. Download EA-FIX . EA-FIX is a non-grid HFT scalper.
- EA-GROWTH: High quality low dd EA using trend grids. Download EA_GROWTHJoin Our Telegram Group
")


