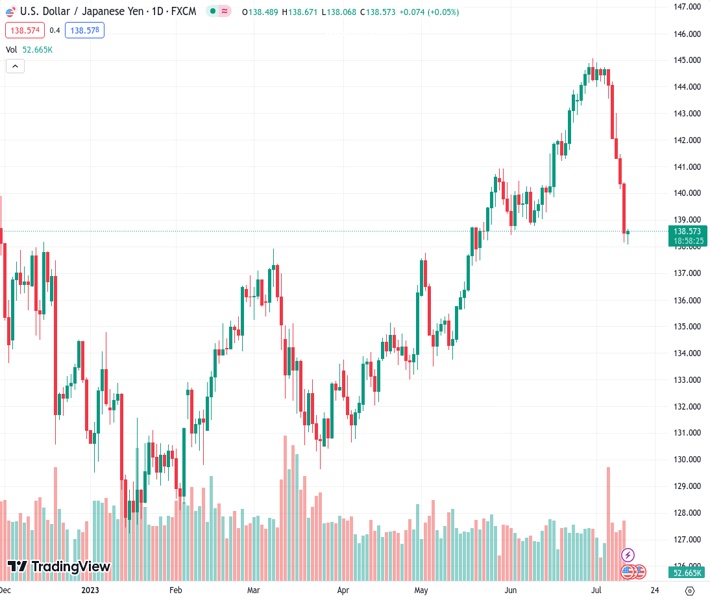
There is some interest in purchasing the USDJPY currency pair at the rate of 138.537, which has prevented it from continuing its recent decline from its highest point of the year so far.
…
This is a premium post.
[s2If !current_user_can(access_s2member_level4)]Please register for FREE REGISTER to read full post below containing analysis. In case of any error or you think you are not able to read the full post below, please email us at support#nehcap.com [lwa][/s2If] [s2If current_user_can(access_s2member_level1)]
- USD/JPY attracts some buying on Thursday and stalls its recent pullback from the YTD peak.
The pair currently trades last at 138.537.
The previous day high was 140.39 while the previous day low was 138.16. The daily 38.2% Fib levels comes at 139.01, expected to provide resistance. Similarly, the daily 61.8% fib level is at 139.54, expected to provide resistance.
The USD/JPY pair stages a modest bounce from the 138.00 neighbourhood, or a nearly two-month low touched during the Asian session on Thursday and hits a fresh daily high in the last hour. Spot prices currently trade around the 138.60 region, up less than 0.10% for the day, and for now, seem to have stalled the recent sharp retracement slide from the YTD peak touched on June 30.
The prevalent risk-on environment – as depicted by an extended rally in the equity markets – undermines the safe-haven Japanese Yen (JPY). This, along with oversold conditions on hourly charts, prompts some intraday short-covering around the USD/JPY pair, especially after a steep decline of around 700 pips witnessed over the past two weeks or so from levels just above the 145.00 psychological mark. That said, any meaningful recovery still seems elusive on the back of the underlying bearish sentiment surrounding the US Dollar (USD).
In fact, the USD Index (DXY), which tracks the Greenback against a basket of currencies, languishes near its lowest level since April 2022 as investors now seem convinced that the Federal Reserve (Fed) will hike interest rates only one more time this year. The bets were reaffirmed by the US CPI report on Wednesday, showing that consumer prices moderated further in June. This leads to a further decline in the US Treasury bond yields, which should continue to weigh on the USD and keep a lid on any meaningful upside for the USD/JPY pair.
Apart from this, speculations that the Bank of Japan (BOJ) will adjust its ultra-loose policy settings as soon as this month could lend support to the JPY and contribute to capping gains for the USD/JPY pair. This, in turn, warrants some caution for bullish traders and makes it prudent to wait for strong follow-through buying before confirming that spot prices have formed a near-term bottom. Traders now look to the US economic docket, featuring the Producer Price Index (PPI) and the Weekly Initial Jobless Claims, for short-term opportunities.
Technical Levels: Supports and Resistances
USDJPY currently trading at 138.61 at the time of writing. Pair opened at 138.5 and is trading with a change of 0.08 % .
| Overview | Overview.1 | |
|---|---|---|
| 0 | Today last price | 138.61 |
| 1 | Today Daily Change | 0.11 |
| 2 | Today Daily Change % | 0.08 |
| 3 | Today daily open | 138.50 |
The pair is trading below its 20 Daily moving average @ 142.79, below its 50 Daily moving average @ 139.99 , above its 100 Daily moving average @ 136.96 and above its 200 Daily moving average @ 137.16
| Trends | Trends.1 | |
|---|---|---|
| 0 | Daily SMA20 | 142.79 |
| 1 | Daily SMA50 | 139.99 |
| 2 | Daily SMA100 | 136.96 |
| 3 | Daily SMA200 | 137.16 |
The previous day high was 140.39 while the previous day low was 138.16. The daily 38.2% Fib levels comes at 139.01, expected to provide resistance. Similarly, the daily 61.8% fib level is at 139.54, expected to provide resistance.
Note the levels of interest below:
- Pivot support is noted at 137.64, 136.78, 135.4
- Pivot resistance is noted at 139.88, 141.25, 142.11
| Levels | Levels.1 |
|---|---|
| Previous Daily High | 140.39 |
| Previous Daily Low | 138.16 |
| Previous Weekly High | 144.91 |
| Previous Weekly Low | 142.07 |
| Previous Monthly High | 145.07 |
| Previous Monthly Low | 138.43 |
| Daily Fibonacci 38.2% | 139.01 |
| Daily Fibonacci 61.8% | 139.54 |
| Daily Pivot Point S1 | 137.64 |
| Daily Pivot Point S2 | 136.78 |
| Daily Pivot Point S3 | 135.40 |
| Daily Pivot Point R1 | 139.88 |
| Daily Pivot Point R2 | 141.25 |
| Daily Pivot Point R3 | 142.11 |
[/s2If]
Download Nehcap EAWe have two EAs that are operational on our LIVE accounts.
- EA-FIX: Check out the details here. Download EA-FIX . EA-FIX is a non-grid HFT scalper.
- EA-GROWTH: High quality low dd EA using trend grids. Download EA_GROWTHJoin Our Telegram Group
")


