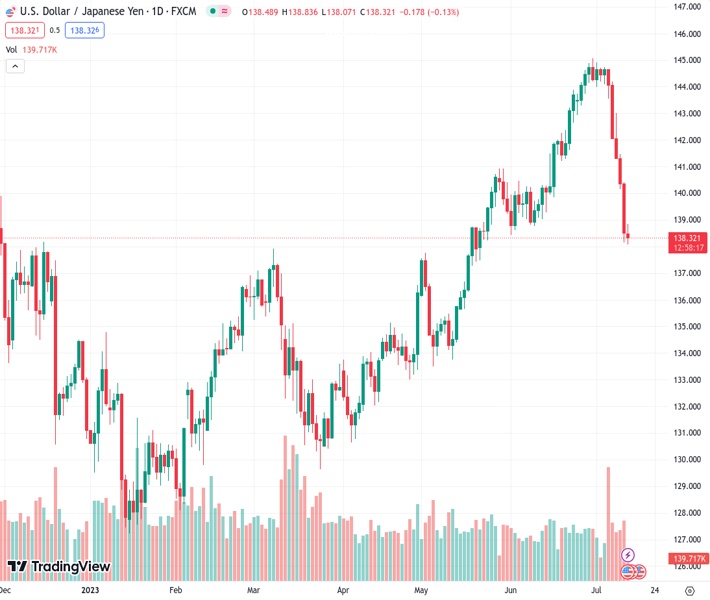
The USDJPY pair, currently at 138.379, has moved lower from its previous level of 138.83 due to the considerable decline in the US Dollar Index.
…
This is a premium post.
[s2If !current_user_can(access_s2member_level4)]Please register for FREE REGISTER to read full post below containing analysis. In case of any error or you think you are not able to read the full post below, please email us at support#nehcap.com [lwa][/s2If] [s2If current_user_can(access_s2member_level1)]
- USD/JPY has retreated from 138.83 amid sheer weakness in the US Dollar Index.
The pair currently trades last at 138.379.
The previous day high was 140.39 while the previous day low was 138.16. The daily 38.2% Fib levels comes at 139.01, expected to provide resistance. Similarly, the daily 61.8% fib level is at 139.54, expected to provide resistance.
The USD/JPY pair has retreated after a short-lived pullback to near 138.83 in the European session. The asset has resumed its downside journey as soft inflationary pressures in the United States have provided assurance that the Federal Reserve (Fed) will come out with only one more interest rate hike by the year-end.
S&P500 futures have added significant gains in London, portraying a cheerful market mood. US equities could face some pressure ahead of second-quarter corporate earnings data. Overall corporate earnings could remain volatile due to higher interest rates by the Fed and tight credit conditions by commercial banks.
The US Dollar Index (DXY) has printed a fresh annual low at 100.34 as hawkish commentaries from Fed policymakers are failing to offset the impact of June’s soft Consumer Price Index (CPI) report. Minneapolis Fed Bank President Neel Kashkari cited that policy rates are needed to raise further and supervisors must ensure that banks are prepared to run new high-inflation stress tests to identify at-risk banks and size individual capital shortfalls.”
Going forward, investors will focus on the Producer Price Index (PPI) (June) data, which will release at 12:30 GMT. The monthly headline and core PPI are expected to show a pace of 0.2%. Annual headline PPI is likely to decelerate to 0.4% vs. the former release of 1.1%. Sheer softening of prices of goods and services at factory gates would cool down inflationary pressures. Also, a decline in PPI would convey that the overall demand is in a declining stage.
On the Tokyo front, rising expectations of a tweak in the Yield Curve Control (YCC) by the Bank of Japan (BoJ) have provided support to the Japanese Yen. The contribution of higher demand in inflationary pressures is rising due to higher wages, which has stemmed chances of communication of shift in the ultra-dovish policy stance.
Technical Levels: Supports and Resistances
USDJPY currently trading at 138.39 at the time of writing. Pair opened at 138.5 and is trading with a change of -0.08 % .
| Overview | Overview.1 | |
|---|---|---|
| 0 | Today last price | 138.39 |
| 1 | Today Daily Change | -0.11 |
| 2 | Today Daily Change % | -0.08 |
| 3 | Today daily open | 138.50 |
The pair is trading below its 20 Daily moving average @ 142.79, below its 50 Daily moving average @ 139.99 , above its 100 Daily moving average @ 136.96 and above its 200 Daily moving average @ 137.16
| Trends | Trends.1 | |
|---|---|---|
| 0 | Daily SMA20 | 142.79 |
| 1 | Daily SMA50 | 139.99 |
| 2 | Daily SMA100 | 136.96 |
| 3 | Daily SMA200 | 137.16 |
The previous day high was 140.39 while the previous day low was 138.16. The daily 38.2% Fib levels comes at 139.01, expected to provide resistance. Similarly, the daily 61.8% fib level is at 139.54, expected to provide resistance.
Note the levels of interest below:
- Pivot support is noted at 137.64, 136.78, 135.4
- Pivot resistance is noted at 139.88, 141.25, 142.11
| Levels | Levels.1 |
|---|---|
| Previous Daily High | 140.39 |
| Previous Daily Low | 138.16 |
| Previous Weekly High | 144.91 |
| Previous Weekly Low | 142.07 |
| Previous Monthly High | 145.07 |
| Previous Monthly Low | 138.43 |
| Daily Fibonacci 38.2% | 139.01 |
| Daily Fibonacci 61.8% | 139.54 |
| Daily Pivot Point S1 | 137.64 |
| Daily Pivot Point S2 | 136.78 |
| Daily Pivot Point S3 | 135.40 |
| Daily Pivot Point R1 | 139.88 |
| Daily Pivot Point R2 | 141.25 |
| Daily Pivot Point R3 | 142.11 |
[/s2If]
Download Nehcap EAWe have two EAs that are operational on our LIVE accounts.
- EA-FIX: Check out the details here. Download EA-FIX . EA-FIX is a non-grid HFT scalper.
- EA-GROWTH: High quality low dd EA using trend grids. Download EA_GROWTHJoin Our Telegram Group
")


