The NZDUSD currency pair is experiencing a strong rally for the second consecutive day, surging to its highest level in over two months.
…
This is a premium post.
[s2If !current_user_can(access_s2member_level4)]Please register for FREE REGISTER to read full post below containing analysis. In case of any error or you think you are not able to read the full post below, please email us at support#nehcap.com [lwa][/s2If] [s2If current_user_can(access_s2member_level1)]
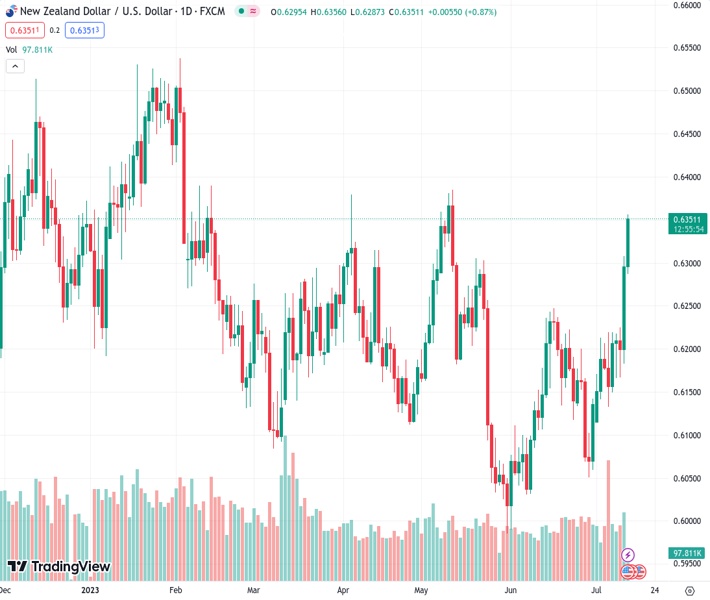
- NZD/USD rallies hard for the second straight day and jumps to over a two-month high.
The pair currently trades last at 0.63499.
The previous day high was 0.6309 while the previous day low was 0.6182. The daily 38.2% Fib levels comes at 0.626, expected to provide support. Similarly, the daily 61.8% fib level is at 0.6231, expected to provide support.
The NZD/USD pair gains strong positive traction for the second straight day on Thursday and jumps to over a two-month peak, around the 0.6350-0.6355 region during the early European session.
The US Dollar (USD) prolongs its recent bearish trajectory and drops to its lowest level since April 2022 in the wake of growing acceptance that the Federal Reserve (Fed) is nearing the end of its policy tightening cycle. Investors now seem convinced that the US central bank will hold interest rates steady for the rest of the year, following the widely expected 25 bps lift-off in July and the bets were reaffirmed by the softer US consumer inflation figures on Wednesday. This, in turn, leads to a further decline in the US Treasury bond yields, which continues to weigh on the buck and turns out to be a key factor pushing the NZD/USD pair higher.
Apart from this, the prevailing risk-on environment – as depicted by an extended rally across the global equity markets – further undermines the safe-haven Greenback and benefits the risk-sensitive Kiwi. This, to a larger extent, overshadows weak domestic data, which showed that business activity in New Zealand’s manufacturing sector contracted in June to its lowest level since November 2022. Even the Reserve Bank of New Zealand’s (RBNZ) decision on Wednesday to leave the official cash rate (OCR) unchanged and the disappointing release of Chinese trade balance data does little to hinder the NZD/USD pair’s positive move.
It is worth recalling that China’s dollar-denominated trade surplus widened less than expected, to $70.62 billion in June from the $65.81 billion previous. Additional details of the report showed that exports plunged by 12.4% as compared to the 9.5% downfall anticipated. This marked the worst decline since the height of the COVID-19 pandemic in March 2020 and suggests that China is struggling with slowing overseas demand. Moreover, imports declined by 6.8%, which further fuels fueling worries about a slowdown in the world’s second-largest economy, though fails to dent the bullish sentiment surrounding the NZD/USD pair.
Market participants now look forward to the US economic docket, featuring the release of the Producer Price Index (PPI) and the usual Weekly Initial Jobless Claims data later during the early North American session. This, along with the US bond yields and the broader risk sentiment, might influence the USD demand and provide some impetus to the NZD/USD pair. Nevertheless, the aforementioned fundamental backdrop and the price action suggest that the path of least resistance for spot prices is to the upside.
Technical Levels: Supports and Resistances
NZDUSD currently trading at 0.6347 at the time of writing. Pair opened at 0.6296 and is trading with a change of 0.81 % .
| Overview | Overview.1 | |
|---|---|---|
| 0 | Today last price | 0.6347 |
| 1 | Today Daily Change | 0.0051 |
| 2 | Today Daily Change % | 0.8100 |
| 3 | Today daily open | 0.6296 |
The pair remains strongly bullish on the daily timeframe. It trades above its 20 SMA @ 0.6175, 50 SMA 0.6171, 100 SMA @ 0.6189 and 200 SMA @ 0.6182.
| Trends | Trends.1 | |
|---|---|---|
| 0 | Daily SMA20 | 0.6175 |
| 1 | Daily SMA50 | 0.6171 |
| 2 | Daily SMA100 | 0.6189 |
| 3 | Daily SMA200 | 0.6182 |
The previous day high was 0.6309 while the previous day low was 0.6182. The daily 38.2% Fib levels comes at 0.626, expected to provide support. Similarly, the daily 61.8% fib level is at 0.6231, expected to provide support.
Note the levels of interest below:
- Pivot support is noted at 0.6216, 0.6135, 0.6089
- Pivot resistance is noted at 0.6343, 0.639, 0.647
| Levels | Levels.1 |
|---|---|
| Previous Daily High | 0.6309 |
| Previous Daily Low | 0.6182 |
| Previous Weekly High | 0.6221 |
| Previous Weekly Low | 0.6124 |
| Previous Monthly High | 0.6250 |
| Previous Monthly Low | 0.5990 |
| Daily Fibonacci 38.2% | 0.6260 |
| Daily Fibonacci 61.8% | 0.6231 |
| Daily Pivot Point S1 | 0.6216 |
| Daily Pivot Point S2 | 0.6135 |
| Daily Pivot Point S3 | 0.6089 |
| Daily Pivot Point R1 | 0.6343 |
| Daily Pivot Point R2 | 0.6390 |
| Daily Pivot Point R3 | 0.6470 |
[/s2If]
Download Nehcap EAWe have two EAs that are operational on our LIVE accounts.
- EA-FIX: Check out the details here. Download EA-FIX . EA-FIX is a non-grid HFT scalper.
- EA-GROWTH: High quality low dd EA using trend grids. Download EA_GROWTHJoin Our Telegram Group
")


