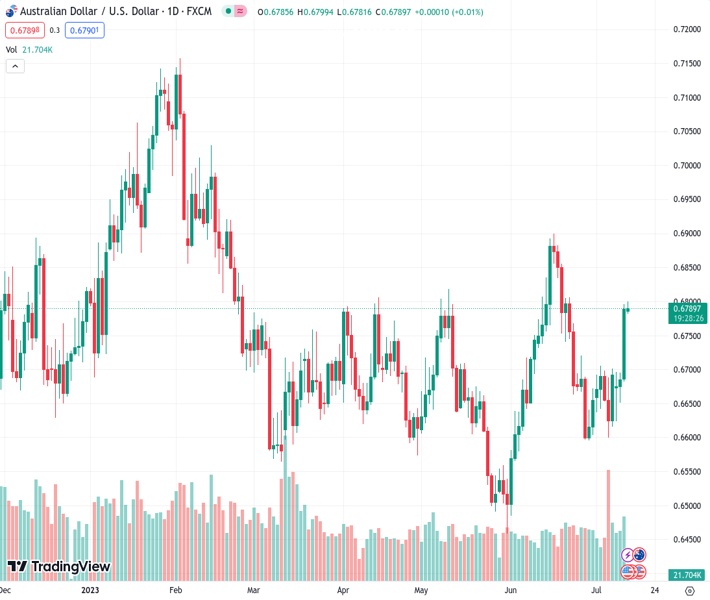
The Australian Dollar to US Dollar exchange rate, currently at 0.67890, is rising to its highest level in three weeks, and this upswing is backed by continuous selling pressure on the US Dollar.
…
This is a premium post.
[s2If !current_user_can(access_s2member_level4)]Please register for FREE REGISTER to read full post below containing analysis. In case of any error or you think you are not able to read the full post below, please email us at support#nehcap.com [lwa][/s2If] [s2If current_user_can(access_s2member_level1)]
- AUD/USD climbs to a three-week high and is supported by sustained selling around the USD.
The pair currently trades last at 0.67890.
The previous day high was 0.6796 while the previous day low was 0.6682. The daily 38.2% Fib levels comes at 0.6753, expected to provide support. Similarly, the daily 61.8% fib level is at 0.6726, expected to provide support.
The AUD/USD pair edges higher during the Asian session on Thursday and looks to build on the overnight breakout rally through a technically significant 200-day Simple Moving Average (SMA). Spot prices currently trade near a three-week top and remain well supported by the prevailing US Dollar (USD) selling bias, with bulls now awaiting a sustained strength beyond the 0.6800 mark before placing fresh bets.
The USD Index (DXY), which tracks the Greenback against a basket of currencies, plunges to its lowest level since April 2022 in the aftermath of softer US consumer inflation figures released on Wednesday. In fact, the headline CPI rose 0.3% in June, while the monthly rise was the smallest since August 2021. Furthermore, the yearly rate decelerated to 4.8% – also the smallest increase in more than two-year. Further moderation in consumer prices reinforced speculations that the Federal Reserve (Fed) will hike interest rates only one more time this year.
Expectations that the Fed is nearing the end of its policy tightening cycle lead to a further decline in the US Treasury bond yields and continue to weigh on the buck, which turns out to be a key factor acting as a tailwind for the AUD/USD pair. Apart from this, the prevalent risk-on mood – as depicted by an extension of the recent rally in the equity markets – is also seen undermining the safe-haven Greenback and benefitting the risk-sensitive Aussie. This, along with the overnight sustained strength beyond the very important 200-day SMA favours bullish traders.
The outlook is reinforced by the fact that technical indicators on the daily chart are holding comfortably in the positive territory and are still far from being in the overbought zone. That said, the Relative Strength (RSI) on hourly charts is flashing slightly overbought conditions and holding back bulls from placing fresh bets around the AUD/USD pair or positioning for any further appreciating move. Nevertheless, the aforementioned fundamental backdrop suggests that the path of least resistance for spot prices remains to the upside.
Market participants now look forward to the US economic docket, featuring the release of the Producer Price Index (PPI) and the usual Weekly Initial Jobless Claims later during the early North American session. This, along with the US bond yields and the broader risk sentiment, will influence the USD price dynamics and provide some impetus to the AUD/USD pair ahead of the key Chinese macro data next Monday.
Technical Levels: Supports and Resistances
AUDUSD currently trading at 0.6793 at the time of writing. Pair opened at 0.6786 and is trading with a change of 0.1 % .
| Overview | Overview.1 | |
|---|---|---|
| 0 | Today last price | 0.6793 |
| 1 | Today Daily Change | 0.0007 |
| 2 | Today Daily Change % | 0.1000 |
| 3 | Today daily open | 0.6786 |
The pair remains strongly bullish on the daily timeframe. It trades above its 20 SMA @ 0.6718, 50 SMA 0.6681, 100 SMA @ 0.6683 and 200 SMA @ 0.6701.
| Trends | Trends.1 | |
|---|---|---|
| 0 | Daily SMA20 | 0.6718 |
| 1 | Daily SMA50 | 0.6681 |
| 2 | Daily SMA100 | 0.6683 |
| 3 | Daily SMA200 | 0.6701 |
The previous day high was 0.6796 while the previous day low was 0.6682. The daily 38.2% Fib levels comes at 0.6753, expected to provide support. Similarly, the daily 61.8% fib level is at 0.6726, expected to provide support.
Note the levels of interest below:
- Pivot support is noted at 0.6713, 0.6641, 0.6599
- Pivot resistance is noted at 0.6827, 0.6869, 0.6941
| Levels | Levels.1 |
|---|---|
| Previous Daily High | 0.6796 |
| Previous Daily Low | 0.6682 |
| Previous Weekly High | 0.6705 |
| Previous Weekly Low | 0.6599 |
| Previous Monthly High | 0.6900 |
| Previous Monthly Low | 0.6484 |
| Daily Fibonacci 38.2% | 0.6753 |
| Daily Fibonacci 61.8% | 0.6726 |
| Daily Pivot Point S1 | 0.6713 |
| Daily Pivot Point S2 | 0.6641 |
| Daily Pivot Point S3 | 0.6599 |
| Daily Pivot Point R1 | 0.6827 |
| Daily Pivot Point R2 | 0.6869 |
| Daily Pivot Point R3 | 0.6941 |
[/s2If]
Download Nehcap EAWe have two EAs that are operational on our LIVE accounts.
- EA-FIX: Check out the details here. Download EA-FIX . EA-FIX is a non-grid HFT scalper.
- EA-GROWTH: High quality low dd EA using trend grids. Download EA_GROWTHJoin Our Telegram Group
")


