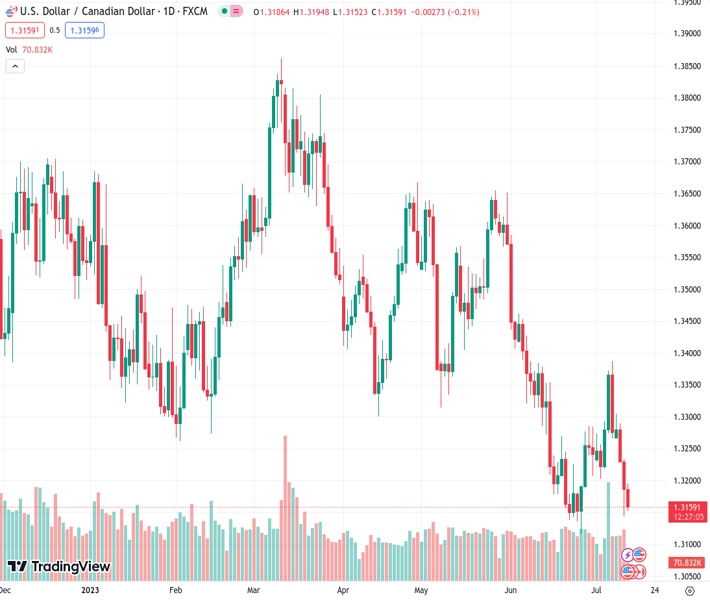
For the third day in a row, there is a high demand for selling USDCAD at a rate of 1.31587. The currency pair continues to be in a depressed state, staying close to its lowest point in the last two weeks.
…
This is a premium post.
[s2If !current_user_can(access_s2member_level4)]Please register for FREE REGISTER to read full post below containing analysis. In case of any error or you think you are not able to read the full post below, please email us at support#nehcap.com [lwa][/s2If] [s2If current_user_can(access_s2member_level1)]
- USD/CAD attracts sellers for the third straight day and remains depressed near a two-week low.
The pair currently trades last at 1.31587.
The previous day high was 1.3234 while the previous day low was 1.3144. The daily 38.2% Fib levels comes at 1.3178, expected to provide resistance. Similarly, the daily 61.8% fib level is at 1.32, expected to provide resistance.
The USD/CAD pair struggles to capitalize on the previous day’s late rebound from the 1.3145-1.3140 area and meets with a fresh supply on Thursday. The intraday downfall – marking the third straight day of a negative move and the fourth in the previous five – drags spot prices back closer to over a two-week low touched on Wednesday.
The Bank of Canada (BoC) on Wednesday hiked its key overnight interest rate by 25 bps, to a 22-year high of 5%, and said that it could raise rates further because of the risk that efforts to return inflation to its 2% target could stall amid excess consumer spending. This, along with the recent bullish run in Crude Oil prices, to the highest level since early May, continues to underpin the commodity-linked Loonie. Apart from this, the prevailing selling bias surrounding the US Dollar (USD) is seen as another factor exerting downward pressure on the USD/CAD pair.
In fact, the USD Index (DXY), which tracks the Greenback against a basket of currencies, sinks to its lowest level since April 2022 as investors now seem convinced that the Federal Reserve (Fed) is nearing the end of its current rate hiking cycles. The bets were lifted by the softer US CPI report released on Wednesday, which pointed to a further moderation in consumer prices. This comes on the back of signs that the US labor market is cooling and should allow the US central bank to soften its hawkish stance, which leads to a further decline in the US bond yields and weighs on the USD.
Apart from this, the risk-on environment – as depicted by the ongoing rally across the global equity markets – further dents the Greenback’s relative safe-haven status and drags the USD/CAD pair lower. Spot prices, meanwhile, remain well within the striking distance of the YTD low, around the 1.3115 region touched in June, which if broken will set the stage for a further near-term depreciating move. Market participants now look to the US economic docket, featuring the release of the Producer Price Index (PPI) and the usual Weekly Initial Jobless Claims data for a fresh impetus.
Technical Levels: Supports and Resistances
USDCAD currently trading at 1.3159 at the time of writing. Pair opened at 1.3188 and is trading with a change of -0.22 % .
| Overview | Overview.1 | |
|---|---|---|
| 0 | Today last price | 1.3159 |
| 1 | Today Daily Change | -0.0029 |
| 2 | Today Daily Change % | -0.2200 |
| 3 | Today daily open | 1.3188 |
The pair remains strongly bearish on the daily time frame. It trades below the 20 SMA @ 1.3228, 50 SMA 1.337, 100 SMA @ 1.348 and 200 SMA @ 1.3498.
| Trends | Trends.1 | |
|---|---|---|
| 0 | Daily SMA20 | 1.3228 |
| 1 | Daily SMA50 | 1.3370 |
| 2 | Daily SMA100 | 1.3480 |
| 3 | Daily SMA200 | 1.3498 |
The previous day high was 1.3234 while the previous day low was 1.3144. The daily 38.2% Fib levels comes at 1.3178, expected to provide resistance. Similarly, the daily 61.8% fib level is at 1.32, expected to provide resistance.
Note the levels of interest below:
- Pivot support is noted at 1.3143, 1.3098, 1.3053
- Pivot resistance is noted at 1.3233, 1.3279, 1.3323
| Levels | Levels.1 |
|---|---|
| Previous Daily High | 1.3234 |
| Previous Daily Low | 1.3144 |
| Previous Weekly High | 1.3387 |
| Previous Weekly Low | 1.3203 |
| Previous Monthly High | 1.3585 |
| Previous Monthly Low | 1.3117 |
| Daily Fibonacci 38.2% | 1.3178 |
| Daily Fibonacci 61.8% | 1.3200 |
| Daily Pivot Point S1 | 1.3143 |
| Daily Pivot Point S2 | 1.3098 |
| Daily Pivot Point S3 | 1.3053 |
| Daily Pivot Point R1 | 1.3233 |
| Daily Pivot Point R2 | 1.3279 |
| Daily Pivot Point R3 | 1.3323 |
[/s2If]
Download Nehcap EAWe have two EAs that are operational on our LIVE accounts.
- EA-FIX: Check out the details here. Download EA-FIX . EA-FIX is a non-grid HFT scalper.
- EA-GROWTH: High quality low dd EA using trend grids. Download EA_GROWTHJoin Our Telegram Group
")


