During the Asian session on Thursday, the USD/MXN currency pair remains within a specific range below the 17.0000 level.
…
This is a premium post.
[s2If !current_user_can(access_s2member_level4)]Please register for FREE REGISTER to read full post below containing analysis. In case of any error or you think you are not able to read the full post below, please email us at support#nehcap.com [lwa][/s2If] [s2If current_user_can(access_s2member_level1)]
- USD/MXN consolidates in a range below the 17.0000 mark through the Asian session on Thursday.
The pair currently trades last at 16.8824.
The previous day high was 17.0645 while the previous day low was 16.8085. The daily 38.2% Fib levels comes at 16.9063, expected to provide resistance. Similarly, the daily 61.8% fib level is at 16.9667, expected to provide resistance.
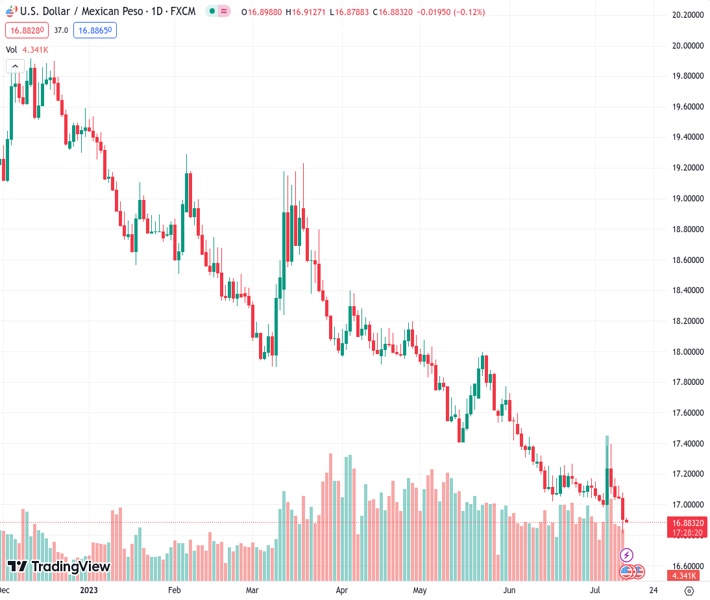
The USD/MXN pair struggles to capitalize on the previous day’s modest bounce from the 16.8085 region, or its lowest level since December 2015 and oscillates in a narrow trading band through the Asian session on Thursday. Spot prices, meanwhile, now seem to have found acceptance below the 17.0000 mark and remain vulnerable to depreciate further.
The decline witnessed over the past three months or so has been along a downward-sloping channel, which points to a well-established short-term bearish trend. Furthermore, the recent failure near the trend-channel resistance, which coincides with the 50-day Simple Moving Average (SMA), and the subsequent slide validates the negative outlook for the USD/MXN pair. That said, the Relative Strength Index (RSI) on the daily chart has moved on the verge of breaking into the oversold zone and warrants some caution.
Hence, any further decline below the overnight swing low is more likely to find support near the lower end of the aforementioned channel, currently pegged around the 16.6750 area. A convincing breakdown below, however, will be seen as a fresh trigger for bearish traders and set the stage for an extension of a one-year-old downtrend.
On the flip side, any meaningful recovery now seems to confront stiff resistance near the 17.0000 horizontal support breakpoint. This is followed by the 17.0500 hurdle, which if cleared decisively might trigger a short-covering rally and lift the USD/MXN pair towards the 17.1200 intermediate barrier. The momentum could get extended further towards the next relevant resistance near the 17.1790-17.1800 region en route to the 17.2420-17.2430 supply zone.
USD/MXN daily chart
Technical Levels: Supports and Resistances
USDMXN currently trading at 16.8848 at the time of writing. Pair opened at 16.902 and is trading with a change of -0.1 % .
| Overview | Overview.1 | |
|---|---|---|
| 0 | Today last price | 16.8848 |
| 1 | Today Daily Change | -0.0172 |
| 2 | Today Daily Change % | -0.1000 |
| 3 | Today daily open | 16.9020 |
The pair remains strongly bearish on the daily time frame. It trades below the 20 SMA @ 17.1012, 50 SMA 17.3945, 100 SMA @ 17.8178 and 200 SMA @ 18.5794.
| Trends | Trends.1 | |
|---|---|---|
| 0 | Daily SMA20 | 17.1012 |
| 1 | Daily SMA50 | 17.3945 |
| 2 | Daily SMA100 | 17.8178 |
| 3 | Daily SMA200 | 18.5794 |
The previous day high was 17.0645 while the previous day low was 16.8085. The daily 38.2% Fib levels comes at 16.9063, expected to provide resistance. Similarly, the daily 61.8% fib level is at 16.9667, expected to provide resistance.
Note the levels of interest below:
- Pivot support is noted at 16.7855, 16.669, 16.5295
- Pivot resistance is noted at 17.0415, 17.181, 17.2975
| Levels | Levels.1 |
|---|---|
| Previous Daily High | 17.0645 |
| Previous Daily Low | 16.8085 |
| Previous Weekly High | 17.3957 |
| Previous Weekly Low | 16.9803 |
| Previous Monthly High | 17.7286 |
| Previous Monthly Low | 17.0243 |
| Daily Fibonacci 38.2% | 16.9063 |
| Daily Fibonacci 61.8% | 16.9667 |
| Daily Pivot Point S1 | 16.7855 |
| Daily Pivot Point S2 | 16.6690 |
| Daily Pivot Point S3 | 16.5295 |
| Daily Pivot Point R1 | 17.0415 |
| Daily Pivot Point R2 | 17.1810 |
| Daily Pivot Point R3 | 17.2975 |
[/s2If]
Download Nehcap EAWe have two EAs that are operational on our LIVE accounts.
- EA-FIX: Check out the details here. Download EA-FIX . EA-FIX is a non-grid HFT scalper.
- EA-GROWTH: High quality low dd EA using trend grids. Download EA_GROWTHJoin Our Telegram Group
")


