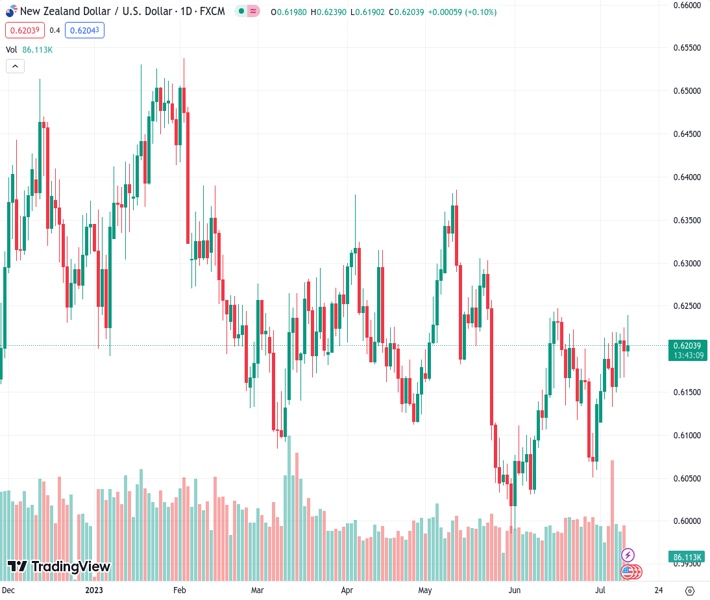
The NZDUSD currency pair, currently trading at 0.62043, has found a level of support around 0.6212 due to the generally positive sentiment in the market.
…
This is a premium post.
[s2If !current_user_can(access_s2member_level4)]Please register for FREE REGISTER to read full post below containing analysis. In case of any error or you think you are not able to read the full post below, please email us at support#nehcap.com [lwa][/s2If] [s2If current_user_can(access_s2member_level1)]
- NZD/USD has sensed support near 0.6212 as the overall market mood is quite upbeat.
The pair currently trades last at 0.62043.
The previous day high was 0.6225 while the previous day low was 0.6166. The daily 38.2% Fib levels comes at 0.6189, expected to provide support. Similarly, the daily 61.8% fib level is at 0.6202, expected to provide support.
The NZD/USD pair has resumed its upside journey after a marginal correction to near 0.6212 in the early London session. The Kiwi asset has remained in the upside trajectory after the Reserve Bank of New Zealand (RBNZ) kept interest rates unchanged at 5.5%.
NZ economy is already going through a technical recession, therefore, the interest rate decision of maintaining the status quo by RBNZ Governor Adrian Orr seems healthy for the economic outlook.
The US Dollar Index (DXY) is demonstrating a non-directional performance after sharply correcting to near 101.34 ahead of the Consumer Price Index (CPI) data for June. Investors are anticipating a decline in inflationary pressures amid declining gasoline prices.
NZD/USD is gathering strength to deliver a breakout of the Inverted Head and Shoulder chart pattern on a two-hour scale. A breakout of the neckline plotted from June 22 high around 0.6220 will result in a bullish reversal.
The Relative Strength Index (RSI) (14) is consistently oscillating in the 40.00-60.00, which indicates a sideways performance.
Going forward, a decisive break above the intraday high around 0.6240 will drive the asset towards May 17 high at 0.6274 followed by the round-level resistance at 0.6300.
Alternatively, a downside move below June 23 low at 0.6116 will expose the asset June 05 low at 0.6041. A slippage below the latter would expose the asset to psychological support at 0.6000.
Technical Levels: Supports and Resistances
NZDUSD currently trading at 0.6214 at the time of writing. Pair opened at 0.62 and is trading with a change of 0.23 % .
| Overview | Overview.1 | |
|---|---|---|
| 0 | Today last price | 0.6214 |
| 1 | Today Daily Change | 0.0014 |
| 2 | Today Daily Change % | 0.2300 |
| 3 | Today daily open | 0.6200 |
The pair remains strongly bullish on the daily timeframe. It trades above its 20 SMA @ 0.617, 50 SMA 0.617, 100 SMA @ 0.6188 and 200 SMA @ 0.6179.
| Trends | Trends.1 | |
|---|---|---|
| 0 | Daily SMA20 | 0.6170 |
| 1 | Daily SMA50 | 0.6170 |
| 2 | Daily SMA100 | 0.6188 |
| 3 | Daily SMA200 | 0.6179 |
The previous day high was 0.6225 while the previous day low was 0.6166. The daily 38.2% Fib levels comes at 0.6189, expected to provide support. Similarly, the daily 61.8% fib level is at 0.6202, expected to provide support.
Note the levels of interest below:
- Pivot support is noted at 0.6169, 0.6138, 0.611
- Pivot resistance is noted at 0.6228, 0.6256, 0.6287
| Levels | Levels.1 |
|---|---|
| Previous Daily High | 0.6225 |
| Previous Daily Low | 0.6166 |
| Previous Weekly High | 0.6221 |
| Previous Weekly Low | 0.6124 |
| Previous Monthly High | 0.6250 |
| Previous Monthly Low | 0.5990 |
| Daily Fibonacci 38.2% | 0.6189 |
| Daily Fibonacci 61.8% | 0.6202 |
| Daily Pivot Point S1 | 0.6169 |
| Daily Pivot Point S2 | 0.6138 |
| Daily Pivot Point S3 | 0.6110 |
| Daily Pivot Point R1 | 0.6228 |
| Daily Pivot Point R2 | 0.6256 |
| Daily Pivot Point R3 | 0.6287 |
[/s2If]
Download Nehcap EAWe have two EAs that are operational on our LIVE accounts.
- EA-FIX: Check out the details here. Download EA-FIX . EA-FIX is a non-grid HFT scalper.
- EA-GROWTH: High quality low dd EA using trend grids. Download EA_GROWTHJoin Our Telegram Group
")


