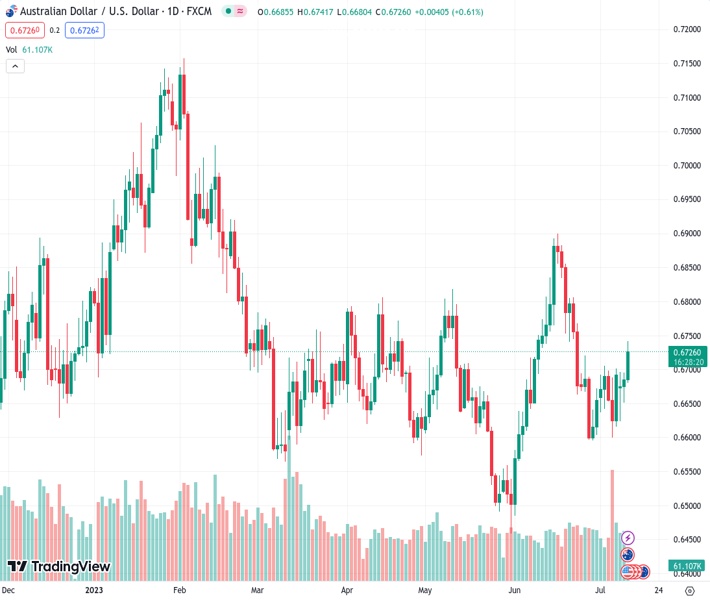
The AUDUSD currency pair, trading at a rate of 0.67241, experienced an increase to its highest level in three weeks on Wednesday due to continued selling of the USD.
…
This is a premium post.
[s2If !current_user_can(access_s2member_level4)]Please register for FREE REGISTER to read full post below containing analysis. In case of any error or you think you are not able to read the full post below, please email us at support#nehcap.com [lwa][/s2If] [s2If current_user_can(access_s2member_level1)]
- AUD/USD rises to a three-week top on Wednesday and is supported by sustained USD selling.
The pair currently trades last at 0.67241.
The previous day high was 0.6695 while the previous day low was 0.6651. The daily 38.2% Fib levels comes at 0.6678, expected to provide support. Similarly, the daily 61.8% fib level is at 0.6668, expected to provide support.
The AUD/USD pair scales higher for the second successive day on Wednesday – also marking the third day of a positive move in the previous four – and touches a nearly three-week high during the Asian session. Spot prices, however, retreat a few pips in the last hour and currently trade around the 0.6720 region, still up over 0.50% for the day.
The US Dollar (USD) selling remains unabated for the fifth straight day in the wake of speculations that the Federal Reserve (Fed) is nearing the end of its current rate-hiking cycle and turns out to be a key factor acting as a tailwind for the AUD/USD pair. Apart from this, a generally positive risk tone drags the safe-haven Greenback to a fresh two-month low and further benefits the risk-sensitive Aussie. Bulls, however, turn caution and refrain from placing aggressive bets ahead of the release of the US consumer inflation figures, due later during the early North American session.
From a technical perspective, the strong intraday positive move beyond the 200-day Simple Moving Average (SMA) hurdle and acceptance above the 0.6700 mark supports prospects for a further near-term appreciating move. Moreover, oscillators on the daily chart have just started gaining positive traction. This, along with hawkish remarks by Reserve Bank of Australia (RBA) Governor Philip Lowe, saying that some further tightening will be required to return inflation to target, suggests that the path of least resistance for the AUD/USD pair is to the upside.
Some follow-through buying beyond the 0.6740-0.6750 region will reaffirm the outlook and allow spot prices to aim back to reclaim the 0.6800 round-figure mark. The upward trajectory could get extended further and lift the AUD/USD pair towards testing the next relevant barrier near the 0.6835-0.6840 region.
On the flip side, the 0.6700 resistance breakpoint now seems to protect the immediate downside. Any further decline is more likely to attract fresh buying and remain limited near the 0.6655-0.6650 region. The latter should act as a pivotal point, which if broken might force the AUD/USD pair to slide back towards testing sub-0.6600 levels. Acceptance below the latter has the potential to drag spot prices further towards the 0.6540 intermediate support en route to the 0.6500 psychological mark and the 0.6460-0.6455 region, or the YTD low touched on May 31.
Technical Levels: Supports and Resistances
AUDUSD currently trading at 0.6722 at the time of writing. Pair opened at 0.6687 and is trading with a change of 0.52 % .
| Overview | Overview.1 | |
|---|---|---|
| 0 | Today last price | 0.6722 |
| 1 | Today Daily Change | 0.0035 |
| 2 | Today Daily Change % | 0.5200 |
| 3 | Today daily open | 0.6687 |
The pair remains strongly bullish on the daily timeframe. It trades above its 20 SMA @ 0.6718, 50 SMA 0.6678, 100 SMA @ 0.6683 and 200 SMA @ 0.6699.
| Trends | Trends.1 | |
|---|---|---|
| 0 | Daily SMA20 | 0.6718 |
| 1 | Daily SMA50 | 0.6678 |
| 2 | Daily SMA100 | 0.6683 |
| 3 | Daily SMA200 | 0.6699 |
The previous day high was 0.6695 while the previous day low was 0.6651. The daily 38.2% Fib levels comes at 0.6678, expected to provide support. Similarly, the daily 61.8% fib level is at 0.6668, expected to provide support.
Note the levels of interest below:
- Pivot support is noted at 0.666, 0.6633, 0.6616
- Pivot resistance is noted at 0.6704, 0.6722, 0.6748
| Levels | Levels.1 |
|---|---|
| Previous Daily High | 0.6695 |
| Previous Daily Low | 0.6651 |
| Previous Weekly High | 0.6705 |
| Previous Weekly Low | 0.6599 |
| Previous Monthly High | 0.6900 |
| Previous Monthly Low | 0.6484 |
| Daily Fibonacci 38.2% | 0.6678 |
| Daily Fibonacci 61.8% | 0.6668 |
| Daily Pivot Point S1 | 0.6660 |
| Daily Pivot Point S2 | 0.6633 |
| Daily Pivot Point S3 | 0.6616 |
| Daily Pivot Point R1 | 0.6704 |
| Daily Pivot Point R2 | 0.6722 |
| Daily Pivot Point R3 | 0.6748 |
[/s2If]
Download Nehcap EAWe have two EAs that are operational on our LIVE accounts.
- EA-FIX: Check out the details here. Download EA-FIX . EA-FIX is a non-grid HFT scalper.
- EA-GROWTH: High quality low dd EA using trend grids. Download EA_GROWTHJoin Our Telegram Group
")


