Silver rebounded on Wednesday and moved closer to its highest point in several weeks, demonstrating positive momentum.
…
This is a premium post.
[s2If !current_user_can(access_s2member_level4)]Please register for FREE REGISTER to read full post below containing analysis. In case of any error or you think you are not able to read the full post below, please email us at support#nehcap.com [lwa][/s2If] [s2If current_user_can(access_s2member_level1)]
- Silver regains positive traction on Wednesday and inches closer to the multi-week high.
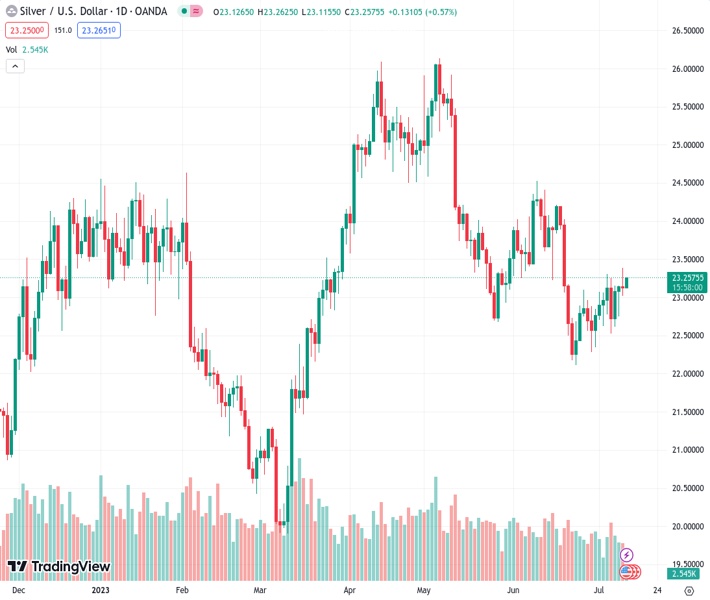
The pair currently trades last at 23.247.
The previous day high was 23.39 while the previous day low was 23.02. The daily 38.2% Fib levels comes at 23.16, expected to provide support. Similarly, the daily 61.8% fib level is at 23.25, expected to provide resistance.
Silver attracts some dip-buying during the Asian session on Wednesday and stalls the overnight rejection slide from the vicinity of the 100-day Simple Moving Average (SMA). The white metal currently trades around the $23.25 region, up nearly 0.50% for the day, and remains well within the striking distance of a three-week high touched on Tuesday.
Looking at the broader picture, the recent recovery from the $22.00 neighbourhood, or the multi-month low set on June 23, has been along an upward-sloping channel. This points to a well-established short-term uptrend and favours bullish traders. Adding to this, technical indicators on the daily chart have just started gaining positive traction and support prospects for a further near-term appreciating move.
That said, any subsequent move up might continue to confront some resistance near the $23.45 region (100-day SMA), which is closely followed by the $23.55-$23.60 confluence. The latter comprises the top end of the aforementioned trend channel and the 38.2% Fibonacci retracement level of the downfall of May-June downfall from the YTD peak, which if cleared will confirm a fresh bullish breakout.
The XAG/USD might then accelerate the momentum towards reclaiming the $24.00 round figure, which coincides with the 50% Fibo. level. The positive momentum could get extended further towards the $24.20-$24.25 intermediate barrier en route to the June monthly swing high, around the $24.55 region, above which the commodity might eventually aim to reclaim the $25.00 psychological mark.
On the flip side, the 23.6% Fibo. level, around the $23.00 round figure, now seems to protect the immediate downside. Any further decline is more likely to attract buyers and remain cushioned near the ascending trend-channel support, currently pegged around the $22.75-$22.70 region. That said, a convincing break below could make the XAG/USD vulnerable to sliding back towards challenging the $22 mark.
Some follow-through selling should pave the way for a fall towards the $21.70-$21.65 zone, below which the XAG/USD could drop to the $21.25 support en route to the $21.00 round figure.
Technical Levels: Supports and Resistances
XAGUSD currently trading at 23.23 at the time of writing. Pair opened at 23.13 and is trading with a change of 0.43 % .
| Overview | Overview.1 | |
|---|---|---|
| 0 | Today last price | 23.23 |
| 1 | Today Daily Change | 0.10 |
| 2 | Today Daily Change % | 0.43 |
| 3 | Today daily open | 23.13 |
The pair is trading above its 20 Daily moving average @ 23.06, below its 50 Daily moving average @ 23.65 , below its 100 Daily moving average @ 23.43 and above its 200 Daily moving average @ 22.71
| Trends | Trends.1 | |
|---|---|---|
| 0 | Daily SMA20 | 23.06 |
| 1 | Daily SMA50 | 23.65 |
| 2 | Daily SMA100 | 23.43 |
| 3 | Daily SMA200 | 22.71 |
The previous day high was 23.39 while the previous day low was 23.02. The daily 38.2% Fib levels comes at 23.16, expected to provide support. Similarly, the daily 61.8% fib level is at 23.25, expected to provide resistance.
Note the levels of interest below:
- Pivot support is noted at 22.97, 22.81, 22.6
- Pivot resistance is noted at 23.34, 23.55, 23.71
| Levels | Levels.1 |
|---|---|
| Previous Daily High | 23.39 |
| Previous Daily Low | 23.02 |
| Previous Weekly High | 23.31 |
| Previous Weekly Low | 22.52 |
| Previous Monthly High | 24.53 |
| Previous Monthly Low | 22.11 |
| Daily Fibonacci 38.2% | 23.16 |
| Daily Fibonacci 61.8% | 23.25 |
| Daily Pivot Point S1 | 22.97 |
| Daily Pivot Point S2 | 22.81 |
| Daily Pivot Point S3 | 22.60 |
| Daily Pivot Point R1 | 23.34 |
| Daily Pivot Point R2 | 23.55 |
| Daily Pivot Point R3 | 23.71 |
[/s2If]
Download Nehcap EAWe have two EAs that are operational on our LIVE accounts.
- EA-FIX: Check out the details here. Download EA-FIX . EA-FIX is a non-grid HFT scalper.
- EA-GROWTH: High quality low dd EA using trend grids. Download EA_GROWTHJoin Our Telegram Group
")


