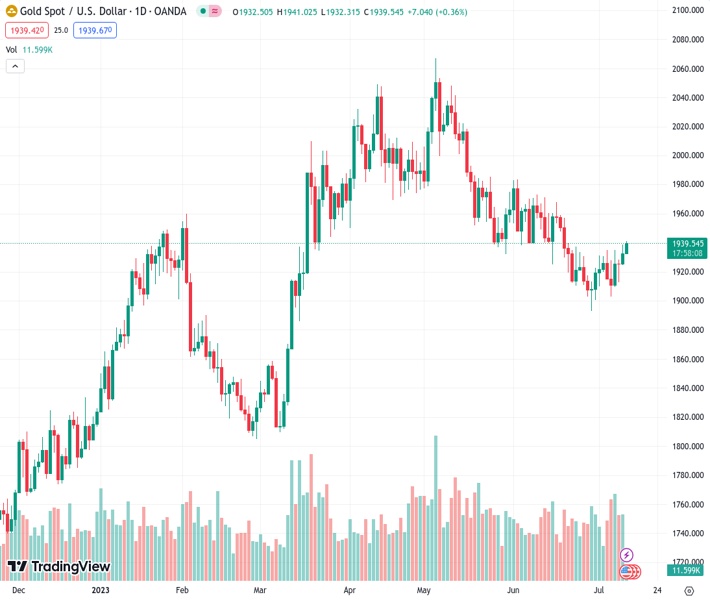
Gold price continues to rise on Wednesday and reaches its highest level in three weeks, with XAUUSD trading at 1,940.07.
…
This is a premium post.
[s2If !current_user_can(access_s2member_level4)]Please register for FREE REGISTER to read full post below containing analysis. In case of any error or you think you are not able to read the full post below, please email us at support#nehcap.com [lwa][/s2If] [s2If current_user_can(access_s2member_level1)]
- Gold price continues gaining traction on Wednesday and climbs to a three-week high.
The pair currently trades last at 1940.07.
The previous day high was 1938.54 while the previous day low was 1924.44. The daily 38.2% Fib levels comes at 1933.15, expected to provide support. Similarly, the daily 61.8% fib level is at 1929.83, expected to provide support.
Gold price builds on its recent goodish rebound from the vicinity of the $1,900 round-figure mark and continues scaling higher through the Asian session on Wednesday. The momentum lifts the XAU/USD to a three-week high, around the $1,940 region in the last hour and is sponsored by sustained US Dollar (USD) selling bias.
In fact, the USD Index (DXY), which tracks the Greenback against a basket of currencies, drops to a two-month low in the wake of speculations that the Federal Reserve (Fed) is nearing the end of the current rate-hiking cycle. This, in turn, is seen as a key factor driving flows towards the US Dollar-denominated Gold price. Investors now seem convinced that the Fed has limited headroom to continue tightening its monetary policy amid signs that the labor market in the United States (US) is cooling and expectations for a further deceleration in consumer prices.
It is worth recalling that the closely-watched US monthly employment details released on Friday showed that the economy added the fewest jobs in 2-1/2 years. Furthermore, the New York Fed’s monthly survey revealed on Monday that the one-year consumer inflation expectation dropped to the lowest level since April 2021, to 3.8% in June from 4.1% in the previous month. This could allow the Fed to soften its hawkish stance and leads to a further decline in the US Treasury bond yields, which undermines the buck and benefits the non-yielding Gold price.
Wednesday’s intraday positive move, meanwhile, pushes the XAU/USD above the $1,935 supply zone and might have already set the stage for a further appreciating move. That said, traders might refrain from placing aggressive bullish bets and prefer to wait for the release of the latest US consumer inflation figures, due later during the early North American session. The crucial report might influence the Fed’s future rate-hike path, which, in turn, will drive the USD demand in the near term and provide some meaningful impetus to the Gold price.
From a technical perspective, any subsequent move up is more likely to confront stiff resistance near the 100-day Simple Moving Average (SMA), currently pegged around the $1,950 area. This is closely followed by the $1,962-$1,964 hurdle, which if cleared decisively might trigger a short-covering rally and lift the Gold price beyond the $1,970-$1,972 supply zone, towards reclaiming the $2,000 psychological mark.
On the flip side, the $1,935 resistance breakpoint now seems to protect the immediate downside ahead of the $1,925 horizontal support and the weekly low, around the $1,912 area. Failure to defend the said support levels could drag the Gold price back towards the $1,900 round-figure mark en route to the multi-month low, around the $1,893-$1,892 region touched in June. A convincing break below the latter will be seen as a fresh trigger for bearish traders.
Technical Levels: Supports and Resistances
XAUUSD currently trading at 1940.64 at the time of writing. Pair opened at 1932.26 and is trading with a change of 0.43 % .
| Overview | Overview.1 | |
|---|---|---|
| 0 | Today last price | 1940.64 |
| 1 | Today Daily Change | 8.38 |
| 2 | Today Daily Change % | 0.43 |
| 3 | Today daily open | 1932.26 |
The pair is trading above its 20 Daily moving average @ 1927.0, below its 50 Daily moving average @ 1959.16 , below its 100 Daily moving average @ 1949.73 and above its 200 Daily moving average @ 1868.82
| Trends | Trends.1 | |
|---|---|---|
| 0 | Daily SMA20 | 1927.00 |
| 1 | Daily SMA50 | 1959.16 |
| 2 | Daily SMA100 | 1949.73 |
| 3 | Daily SMA200 | 1868.82 |
The previous day high was 1938.54 while the previous day low was 1924.44. The daily 38.2% Fib levels comes at 1933.15, expected to provide support. Similarly, the daily 61.8% fib level is at 1929.83, expected to provide support.
Note the levels of interest below:
- Pivot support is noted at 1924.95, 1917.65, 1910.85
- Pivot resistance is noted at 1939.05, 1945.85, 1953.15
| Levels | Levels.1 |
|---|---|
| Previous Daily High | 1938.54 |
| Previous Daily Low | 1924.44 |
| Previous Weekly High | 1935.09 |
| Previous Weekly Low | 1902.77 |
| Previous Monthly High | 1983.50 |
| Previous Monthly Low | 1893.01 |
| Daily Fibonacci 38.2% | 1933.15 |
| Daily Fibonacci 61.8% | 1929.83 |
| Daily Pivot Point S1 | 1924.95 |
| Daily Pivot Point S2 | 1917.65 |
| Daily Pivot Point S3 | 1910.85 |
| Daily Pivot Point R1 | 1939.05 |
| Daily Pivot Point R2 | 1945.85 |
| Daily Pivot Point R3 | 1953.15 |
[/s2If]
Download Nehcap EAWe have two EAs that are operational on our LIVE accounts.
- EA-FIX: Check out the details here. Download EA-FIX . EA-FIX is a non-grid HFT scalper.
- EA-GROWTH: High quality low dd EA using trend grids. Download EA_GROWTHJoin Our Telegram Group
")


