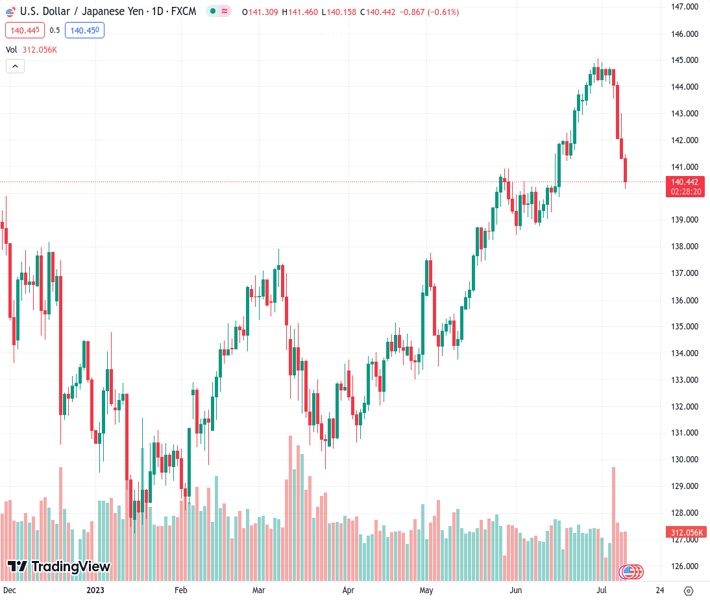
The USDJPY pair has dropped for the fourth day in a row and is now approaching the 140.30 mark.
…
This is a premium post.
[s2If !current_user_can(access_s2member_level4)]Please register for FREE REGISTER to read full post below containing analysis. In case of any error or you think you are not able to read the full post below, please email us at support#nehcap.com [lwa][/s2If] [s2If current_user_can(access_s2member_level1)]
- USD/JPY records its fourth consecutive day of losses, falling near 140.30.
The pair currently trades last at 140.405.
The previous day high was 143.0 while the previous day low was 141.28. The daily 38.2% Fib levels comes at 141.94, expected to provide resistance. Similarly, the daily 61.8% fib level is at 142.35, expected to provide resistance.
On Tuesday, the USD/JPY continued to lose ground amid the broad USD weakness. Ahead of the release of Consumer Price Index (CPI) data, investors expect inflation to decelerate while hawkish bets on the Federal Reserve remain steady. On the JPY’s side, monetary policy pivot expectations allow the Yen to advance.
In the US, the focus is on Wednesday’s Consumer Price Index (CPI) data. The headline figure is expected to drop to 3.1% in June YoY from its previous 4%, while the Core measure to 5% from its last figure of 5.3%. As Federal Reserve’s officials sounded hawkish on Monday, markets believe a 25 basis points (bps) hike in the July meeting is a done deal. Moreover, the odds of another hike this cycle stand at 35%, but those expectations may change according to the outcome of the inflation data in Wednesday’s session.
On the Japanese side, while most market expectations point towards the Bank of Japan (BoJ) maintaining its current monetary policy during its July meeting, economists at Rabobank anticipate that the central bank may provide some indication regarding potential adjustments to the policy. This signal could come alongside an updated macroeconomic forecast. The recent wage increase in Japan during May has garnered significant attention from the BoJ, making it a crucial aspect to monitor in the upcoming data releases.
In that sense, Wednesday’s Core Machine Tool orders from May and Producer Price Index from June will be closely watched.
According to the daily chart, the technical outlook for the USD/JPY suggests strong bearish momentum for the short term. However, indicators in the 4-hour chart point at oversold condition, suggesting an upwards correction may be in the horizon. Returning to the daily chart, the Relative Strength Index (RSI) shows a steep negative slope in negative territory while the Moving Average Convergence Divergence (MACD) prints rising red bars.
Support levels: 139.90,139.30,139.00.
Resistance levels: 141.25, 142.00, 142.85 (20-day Simple Moving Average).
Technical Levels: Supports and Resistances
USDJPY currently trading at 140.34 at the time of writing. Pair opened at 141.31 and is trading with a change of -0.69 % .
| Overview | Overview.1 | |
|---|---|---|
| 0 | Today last price | 140.34 |
| 1 | Today Daily Change | -0.97 |
| 2 | Today Daily Change % | -0.69 |
| 3 | Today daily open | 141.31 |
The pair is trading below its 20 Daily moving average @ 142.86, above its 50 Daily moving average @ 139.84 , above its 100 Daily moving average @ 136.87 and above its 200 Daily moving average @ 137.21
| Trends | Trends.1 | |
|---|---|---|
| 0 | Daily SMA20 | 142.86 |
| 1 | Daily SMA50 | 139.84 |
| 2 | Daily SMA100 | 136.87 |
| 3 | Daily SMA200 | 137.21 |
The previous day high was 143.0 while the previous day low was 141.28. The daily 38.2% Fib levels comes at 141.94, expected to provide resistance. Similarly, the daily 61.8% fib level is at 142.35, expected to provide resistance.
Note the levels of interest below:
- Pivot support is noted at 140.72, 140.14, 139.0
- Pivot resistance is noted at 142.45, 143.59, 144.18
| Levels | Levels.1 |
|---|---|
| Previous Daily High | 143.00 |
| Previous Daily Low | 141.28 |
| Previous Weekly High | 144.91 |
| Previous Weekly Low | 142.07 |
| Previous Monthly High | 145.07 |
| Previous Monthly Low | 138.43 |
| Daily Fibonacci 38.2% | 141.94 |
| Daily Fibonacci 61.8% | 142.35 |
| Daily Pivot Point S1 | 140.72 |
| Daily Pivot Point S2 | 140.14 |
| Daily Pivot Point S3 | 139.00 |
| Daily Pivot Point R1 | 142.45 |
| Daily Pivot Point R2 | 143.59 |
| Daily Pivot Point R3 | 144.18 |
[/s2If]
Download Nehcap EAWe have two EAs that are operational on our LIVE accounts.
- EA-FIX: Check out the details here. Download EA-FIX . EA-FIX is a non-grid HFT scalper.
- EA-GROWTH: High quality low dd EA using trend grids. Download EA_GROWTHJoin Our Telegram Group
")


