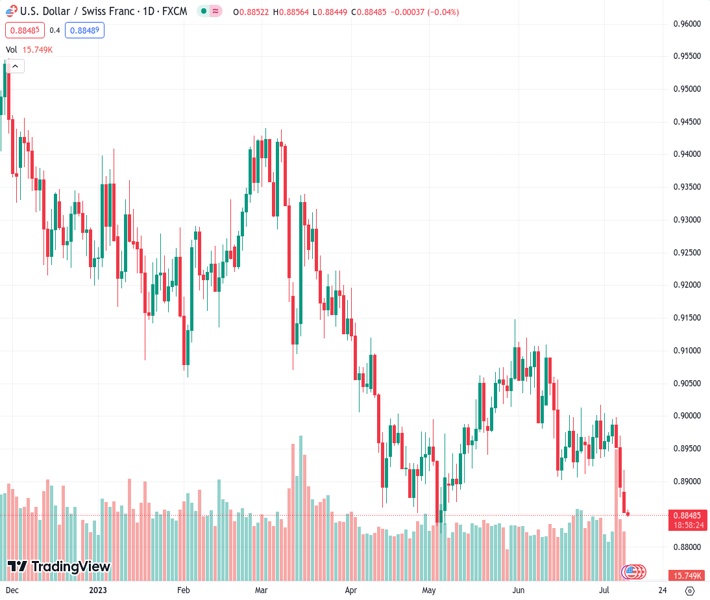
The USDCHF currency pair, currently at the level of 0.88485, continues to gradually decrease for the fourth consecutive day and reaches a point that hasn’t been experienced in over two months.
…
This is a premium post.
[s2If !current_user_can(access_s2member_level4)]Please register for FREE REGISTER to read full post below containing analysis. In case of any error or you think you are not able to read the full post below, please email us at support#nehcap.com [lwa][/s2If] [s2If current_user_can(access_s2member_level1)]
- USD/CHF drifts lower for the fourth straight day and drops to over a two-month low.
The pair currently trades last at 0.88485.
The previous day high was 0.8918 while the previous day low was 0.8852. The daily 38.2% Fib levels comes at 0.8877, expected to provide resistance. Similarly, the daily 61.8% fib level is at 0.8893, expected to provide resistance.
The USD/CHF pair remains under some selling pressure for the fourth straight day on Tuesday and slides to over a two-month low, around the 0.8845 region during the Asian session.
Speculations that the Federal Reserve (Fed) will soften its hawkish stance sooner rather than later keep the US Dollar (USD) bulls on the defensive near its lowest level since June 22, which, in turn, is seen acting as a headwind for the USD/CHF pair. In fact, two Fed officials said Monday that the end to the current monetary policy tightening cycle is getting close. This led to the overnight pullback in the US Treasury bond yields and turns out to be a key factor weighing on the Greenback.
The Fed speakers, however, noted that the US central bank will likely need to raise interest rates further to bring down inflation. Moreover, the US monthly jobs report released on Friday showed an unexpected dip in the unemployment rate and persistently strong wage growth. This points to still-tight labor market conditions and supports prospects for further policy tightening by the Fed, which should help limit any meaningful downfall for the US bond yields and the Greenback.
Apart from this, a slight recovery in the global risk sentiment – as depicted by a generally positive tone around the equity markets – could undermine the safe-haven Swiss Franc (CHF) and lend some support to the USD/CHF pair. Moreover, the Relative Strength Index (RSI) on hourly charts is flashing oversold conditions and might hold back traders from placing aggressive bearish bets around the major ahead of the release of the latest US consumer inflation figures on Wednesday.
In the absence of any relevant market-moving economic releases from the US, a subsequent decline is more likely to find some support near the 0.8820 area, or the YTD low touched in May. The aforementioned fundamental backdrop, however, suggests that the path of least resistance for the USD/CHF pair is to the downside. Hence, any meaningful recovery attempt might still be seen as a selling opportunity and runs the risk of fizzling out rather quickly.
Technical Levels: Supports and Resistances
USDCHF currently trading at 0.8848 at the time of writing. Pair opened at 0.8854 and is trading with a change of -0.07 % .
| Overview | Overview.1 | |
|---|---|---|
| 0 | Today last price | 0.8848 |
| 1 | Today Daily Change | -0.0006 |
| 2 | Today Daily Change % | -0.0700 |
| 3 | Today daily open | 0.8854 |
The pair remains strongly bearish on the daily time frame. It trades below the 20 SMA @ 0.8957, 50 SMA 0.8982, 100 SMA @ 0.9067 and 200 SMA @ 0.9277.
| Trends | Trends.1 | |
|---|---|---|
| 0 | Daily SMA20 | 0.8957 |
| 1 | Daily SMA50 | 0.8982 |
| 2 | Daily SMA100 | 0.9067 |
| 3 | Daily SMA200 | 0.9277 |
The previous day high was 0.8918 while the previous day low was 0.8852. The daily 38.2% Fib levels comes at 0.8877, expected to provide resistance. Similarly, the daily 61.8% fib level is at 0.8893, expected to provide resistance.
Note the levels of interest below:
- Pivot support is noted at 0.8831, 0.8809, 0.8765
- Pivot resistance is noted at 0.8897, 0.8941, 0.8963
| Levels | Levels.1 |
|---|---|
| Previous Daily High | 0.8918 |
| Previous Daily Low | 0.8852 |
| Previous Weekly High | 0.9005 |
| Previous Weekly Low | 0.8876 |
| Previous Monthly High | 0.9120 |
| Previous Monthly Low | 0.8902 |
| Daily Fibonacci 38.2% | 0.8877 |
| Daily Fibonacci 61.8% | 0.8893 |
| Daily Pivot Point S1 | 0.8831 |
| Daily Pivot Point S2 | 0.8809 |
| Daily Pivot Point S3 | 0.8765 |
| Daily Pivot Point R1 | 0.8897 |
| Daily Pivot Point R2 | 0.8941 |
| Daily Pivot Point R3 | 0.8963 |
[/s2If]
Download Nehcap EAWe have two EAs that are operational on our LIVE accounts.
- EA-FIX: Check out the details here. Download EA-FIX . EA-FIX is a non-grid HFT scalper.
- EA-GROWTH: High quality low dd EA using trend grids. Download EA_GROWTHJoin Our Telegram Group
")


