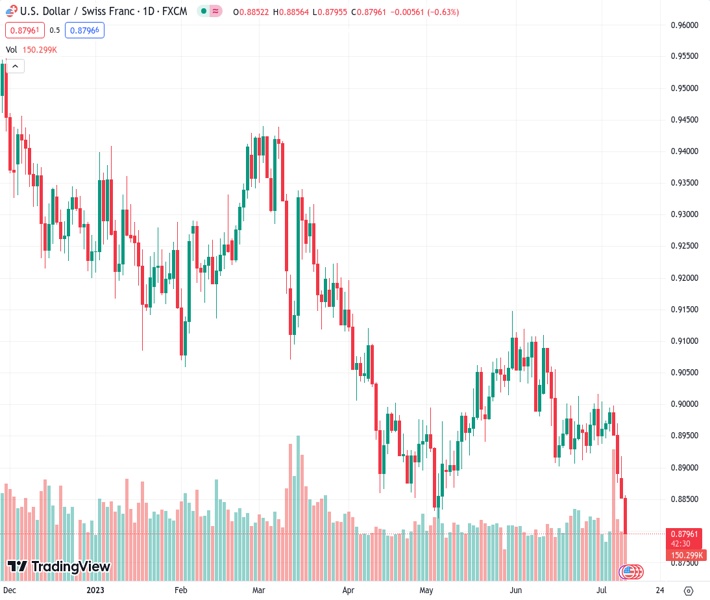
The USDCHF at the price of 0.87940 is closely monitoring the possibility of reaching its lowest point in 2021 at 0.8757, as it has already slipped below the previous year-to-date low of 0.8819.
…
This is a premium post.
[s2If !current_user_can(access_s2member_level4)]Please register for FREE REGISTER to read full post below containing analysis. In case of any error or you think you are not able to read the full post below, please email us at support#nehcap.com [lwa][/s2If] [s2If current_user_can(access_s2member_level1)]
- USD/CHF eyes 2021 low at 0.8757 after the pair slid past the prior’s YTD low of 0.8819.
The pair currently trades last at 0.87940.
The previous day high was 0.8918 while the previous day low was 0.8852. The daily 38.2% Fib levels comes at 0.8877, expected to provide resistance. Similarly, the daily 61.8% fib level is at 0.8893, expected to provide resistance.
USD/CHF plunges to new two-year lows as the greenback falls sharply ahead of the release of the Consumer Price Index (CPI) in the United States (US). At the time of writing, the USD/CHF is trading at 0.8799, down 1.04%, after hitting a high of 0.8918.
The USD/CHF remains downward biased and set to extend its losses to fresh multi-year lows, with the 2021 yearly low in sight at 0.8757. Notably, the USD/CHF peaked just below the 0.9000 figure, which capped the pair’s rallies since April 2023.
As the USD/CHF continues to trend lower, below 0.8800, the next support emerged at 0.8757. A breach of the latter will expose the 0.8750, followed by the 0.8700. As the pair edged lower, a divergence between the USD/CHF price action printing lower lows, the three-day Rate of Change (RoC) shows sellers are losing some momentum. Nevertheless, mixed signals between the latter and the Relative Strength Index (RSI), depicting sellers remain in charge, could refrain traders from opening fresh shorts before releasing crucial US economic data.
Contrarily, the USD/CHF first resistance would emerge at the 0.8800 mark. Once cleared, the USD/CHF could reach the June 16 swing low-turned resistance at 0.8902 before challenging the 20-day Exponential Moving Average (EMA) at 0.8942.
Technical Levels: Supports and Resistances
USDCHF currently trading at 0.8797 at the time of writing. Pair opened at 0.8854 and is trading with a change of -0.64 % .
| Overview | Overview.1 | |
|---|---|---|
| 0 | Today last price | 0.8797 |
| 1 | Today Daily Change | -0.0057 |
| 2 | Today Daily Change % | -0.6400 |
| 3 | Today daily open | 0.8854 |
The pair remains strongly bearish on the daily time frame. It trades below the 20 SMA @ 0.8957, 50 SMA 0.8982, 100 SMA @ 0.9067 and 200 SMA @ 0.9277.
| Trends | Trends.1 | |
|---|---|---|
| 0 | Daily SMA20 | 0.8957 |
| 1 | Daily SMA50 | 0.8982 |
| 2 | Daily SMA100 | 0.9067 |
| 3 | Daily SMA200 | 0.9277 |
The previous day high was 0.8918 while the previous day low was 0.8852. The daily 38.2% Fib levels comes at 0.8877, expected to provide resistance. Similarly, the daily 61.8% fib level is at 0.8893, expected to provide resistance.
Note the levels of interest below:
- Pivot support is noted at 0.8831, 0.8809, 0.8765
- Pivot resistance is noted at 0.8897, 0.8941, 0.8963
| Levels | Levels.1 |
|---|---|
| Previous Daily High | 0.8918 |
| Previous Daily Low | 0.8852 |
| Previous Weekly High | 0.9005 |
| Previous Weekly Low | 0.8876 |
| Previous Monthly High | 0.9120 |
| Previous Monthly Low | 0.8902 |
| Daily Fibonacci 38.2% | 0.8877 |
| Daily Fibonacci 61.8% | 0.8893 |
| Daily Pivot Point S1 | 0.8831 |
| Daily Pivot Point S2 | 0.8809 |
| Daily Pivot Point S3 | 0.8765 |
| Daily Pivot Point R1 | 0.8897 |
| Daily Pivot Point R2 | 0.8941 |
| Daily Pivot Point R3 | 0.8963 |
[/s2If]
Download Nehcap EAWe have two EAs that are operational on our LIVE accounts.
- EA-FIX: Check out the details here. Download EA-FIX . EA-FIX is a non-grid HFT scalper.
- EA-GROWTH: High quality low dd EA using trend grids. Download EA_GROWTHJoin Our Telegram Group
")


