The USDCAD currency pair experiences a slight improvement after falling to a low point earlier in the day on Tuesday.
…
This is a premium post.
[s2If !current_user_can(access_s2member_level4)]Please register for FREE REGISTER to read full post below containing analysis. In case of any error or you think you are not able to read the full post below, please email us at support#nehcap.com [lwa][/s2If] [s2If current_user_can(access_s2member_level1)]
- USD/CAD stages a modest recovery from a multi-day trough touched earlier this Tuesday.
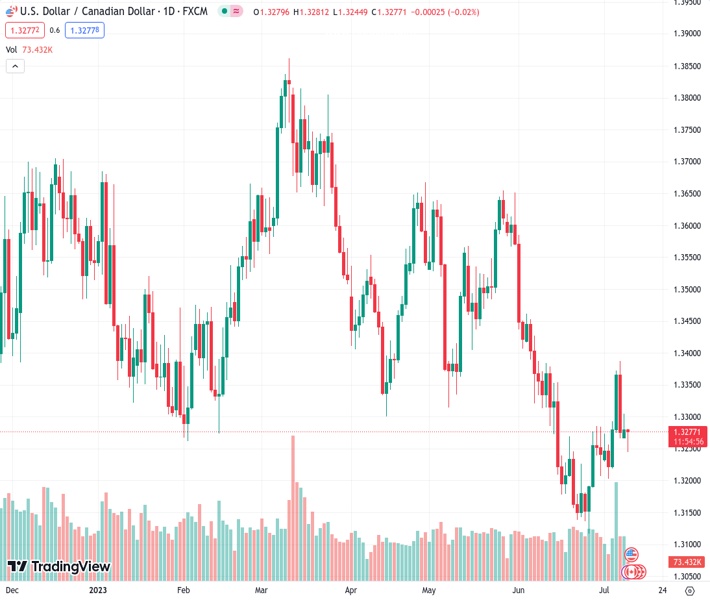
The pair currently trades last at 1.32778.
The previous day high was 1.3304 while the previous day low was 1.3268. The daily 38.2% Fib levels comes at 1.3291, expected to provide resistance. Similarly, the daily 61.8% fib level is at 1.3282, expected to provide resistance.
The USD/CAD pair comes under some renewed selling pressure on Tuesday and drops to a four-day low, around the 1.3245 region during the early European session. Spot prices, however, manage to recover a major part of the intraday losses and currently trade near the 1.3275-1.3280 region, nearly unchanged for the day.
Any meaningful upside for the USD/CAD pair, however, seems elusive in the wake of sustained US Dollar (USD) selling bias and the emergence of some buying around Crude Oil prices, which tends to underpin the commodity-linked Loonie. Speculation that the Federal Reserve (Fed) is nearing the end of its policy tightening cycle led to a further decline in the US Treasury bond yields and drag the USD to a two-month low. Apart from this, signs of stability in the equity markets drag the safe-haven buck to a two-month low.
Crude Oil prices, meanwhile, inch back closer to a multi-week high touched on Monday and remain well supported by supply cuts announced by the world’s biggest oil exporters – Saudi Arabia and Russia – for August. Apart from this, hopes for a recovery in fuel demand during the second half of 2023 lend some support to the black liquid. That said, looming recession risk might keep a lid on any further gains for Oil prices. This, along with bets for a 25 bps Fed rate hike in July, could help limit losses for the USD/CAD pair.
Despite a slight miss from the headline US NFP print, the unexpected dip in the unemployment rate and persistently strong wage growth pointed to still-tight labor market conditions. Moreover, several Fed officials on Monday backed the case for further policy tightening by the US central bank. This, in turn, assists the USD/CAD pair to attract some dip-buying as traders seem reluctant to place aggressive directional bets ahead of the US consumer inflation figures on Wednesday, which will influence the USD demand in the near term.
In the meantime, the USD will take cues from the US bond yields and the broader risk sentiment in the absence of any relevant market-moving economic data. Apart from this, Oil price dynamics should provide some impetus to the USD/CAD pair and allow traders to grab short-term opportunities.
Technical Levels: Supports and Resistances
USDCAD currently trading at 1.3277 at the time of writing. Pair opened at 1.328 and is trading with a change of -0.02 % .
| Overview | Overview.1 | |
|---|---|---|
| 0 | Today last price | 1.3277 |
| 1 | Today Daily Change | -0.0003 |
| 2 | Today Daily Change % | -0.0200 |
| 3 | Today daily open | 1.3280 |
The pair is trading above its 20 Daily moving average @ 1.3239, below its 50 Daily moving average @ 1.3386 , below its 100 Daily moving average @ 1.3487 and below its 200 Daily moving average @ 1.3501
| Trends | Trends.1 | |
|---|---|---|
| 0 | Daily SMA20 | 1.3239 |
| 1 | Daily SMA50 | 1.3386 |
| 2 | Daily SMA100 | 1.3487 |
| 3 | Daily SMA200 | 1.3501 |
The previous day high was 1.3304 while the previous day low was 1.3268. The daily 38.2% Fib levels comes at 1.3291, expected to provide resistance. Similarly, the daily 61.8% fib level is at 1.3282, expected to provide resistance.
Note the levels of interest below:
- Pivot support is noted at 1.3265, 1.3249, 1.3229
- Pivot resistance is noted at 1.33, 1.332, 1.3336
| Levels | Levels.1 |
|---|---|
| Previous Daily High | 1.3304 |
| Previous Daily Low | 1.3268 |
| Previous Weekly High | 1.3387 |
| Previous Weekly Low | 1.3203 |
| Previous Monthly High | 1.3585 |
| Previous Monthly Low | 1.3117 |
| Daily Fibonacci 38.2% | 1.3291 |
| Daily Fibonacci 61.8% | 1.3282 |
| Daily Pivot Point S1 | 1.3265 |
| Daily Pivot Point S2 | 1.3249 |
| Daily Pivot Point S3 | 1.3229 |
| Daily Pivot Point R1 | 1.3300 |
| Daily Pivot Point R2 | 1.3320 |
| Daily Pivot Point R3 | 1.3336 |
[/s2If]
Download Nehcap EAWe have two EAs that are operational on our LIVE accounts.
- EA-FIX: Check out the details here. Download EA-FIX . EA-FIX is a non-grid HFT scalper.
- EA-GROWTH: High quality low dd EA using trend grids. Download EA_GROWTHJoin Our Telegram Group
")


