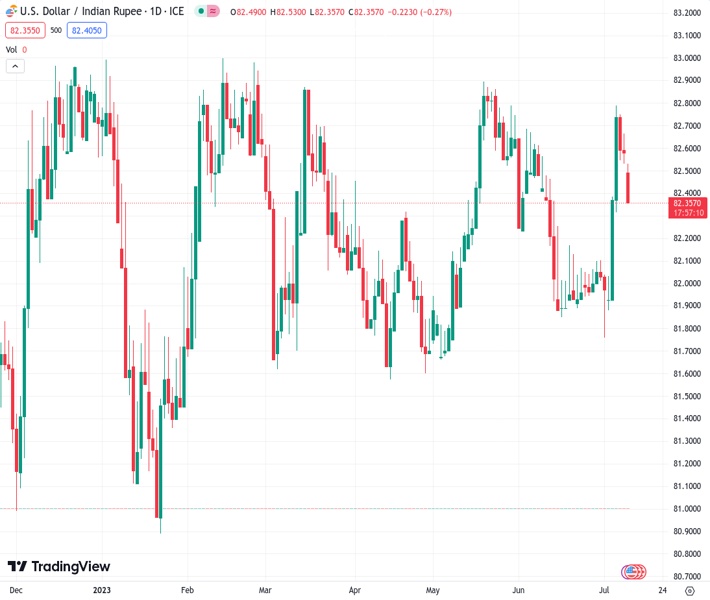
The USD/INR currency pair has dropped to 82.3700, reaching its lowest level of the day and extending its decline for the third consecutive day. According to the viewpoint of Nehcap, it is predicted that there will be more downward movement in the future.
…
This is a premium post.
[s2If !current_user_can(access_s2member_level4)]Please register for FREE REGISTER to read full post below containing analysis. In case of any error or you think you are not able to read the full post below, please email us at support#nehcap.com [lwa][/s2If] [s2If current_user_can(access_s2member_level1)]
- USD/INR takes offers to renew intraday low, prints three-day losing streak.
The pair currently trades last at 82.3700.
The previous day high was 82.7256 while the previous day low was 82.4822. The daily 38.2% Fib levels comes at 82.5752, expected to provide resistance. Similarly, the daily 61.8% fib level is at 82.6327, expected to provide resistance.
USD/INR drops for the third consecutive day as it renews intraday low near 82.40 amid early Tuesday in Europe. In doing so, the Indian Rupee (INR) pair pokes a one-week-old rising support line while extending the previous week’s retreat after failing to cross the 82.80 upside hurdle.
Adding strength to the downside bias are the bearish MACD signals and the pair’s sustained observance of a downward-sloping resistance line from Thursday, close to 82.60 at the latest.
With this, the USD/INR pair is likely to break the 82.60 support but a convergence of the 200-SMA and a seven-week-old resistance-turned-support, around 82.25 by the press time, appears a tough nut to crack for the pair sellers.
Also acting as a downside filter is the 38.2% Fibonacci retracement of the pair’s May-July downside, near 82.15, as well as the 82.00 round figure.
On the flip side, a clear upside break of the immediate resistance line, near 82.60, could propel the USD/INR price towards the latest peak of around 82.80. Following that, the 83.00 round figure will be in the spotlight.
Overall, USD/INR is likely to witness further downside pressure but the bears may find it difficult to keep the reins past 82.25.
Trend: Further downside expected
Technical Levels: Supports and Resistances
USDINR currently trading at 82.4115 at the time of writing. Pair opened at 82.5836 and is trading with a change of -0.21% % .
| Overview | Overview.1 | |
|---|---|---|
| 0 | Today last price | 82.4115 |
| 1 | Today Daily Change | -0.1721 |
| 2 | Today Daily Change % | -0.21% |
| 3 | Today daily open | 82.5836 |
The pair remains strongly bullish on the daily timeframe. It trades above its 20 SMA @ 82.13, 50 SMA 82.2746, 100 SMA @ 82.2333 and 200 SMA @ 82.1773.
| Trends | Trends.1 | |
|---|---|---|
| 0 | Daily SMA20 | 82.1300 |
| 1 | Daily SMA50 | 82.2746 |
| 2 | Daily SMA100 | 82.2333 |
| 3 | Daily SMA200 | 82.1773 |
The previous day high was 82.7256 while the previous day low was 82.4822. The daily 38.2% Fib levels comes at 82.5752, expected to provide resistance. Similarly, the daily 61.8% fib level is at 82.6327, expected to provide resistance.
Note the levels of interest below:
- Pivot support is noted at 82.4686, 82.3537, 82.2252
- Pivot resistance is noted at 82.7121, 82.8406, 82.9555
| Levels | Levels.1 |
|---|---|
| Previous Daily High | 82.7256 |
| Previous Daily Low | 82.4822 |
| Previous Weekly High | 82.8334 |
| Previous Weekly Low | 81.7597 |
| Previous Monthly High | 82.7370 |
| Previous Monthly Low | 81.8477 |
| Daily Fibonacci 38.2% | 82.5752 |
| Daily Fibonacci 61.8% | 82.6327 |
| Daily Pivot Point S1 | 82.4686 |
| Daily Pivot Point S2 | 82.3537 |
| Daily Pivot Point S3 | 82.2252 |
| Daily Pivot Point R1 | 82.7121 |
| Daily Pivot Point R2 | 82.8406 |
| Daily Pivot Point R3 | 82.9555 |
[/s2If]
Download Nehcap EAWe have two EAs that are operational on our LIVE accounts.
- EA-FIX: Check out the details here. Download EA-FIX . EA-FIX is a non-grid HFT scalper.
- EA-GROWTH: High quality low dd EA using trend grids. Download EA_GROWTHJoin Our Telegram Group
")


