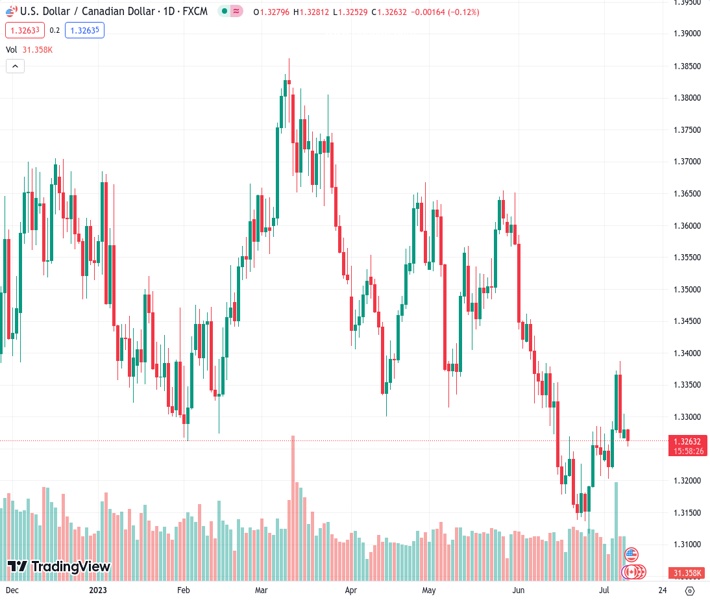
The USD/CAD currency pair encounters a new level of selling pressure on Tuesday at a rate of 1.32640. This is mainly due to a variety of factors contributing to its downward movement.
…
This is a premium post.
[s2If !current_user_can(access_s2member_level4)]Please register for FREE REGISTER to read full post below containing analysis. In case of any error or you think you are not able to read the full post below, please email us at support#nehcap.com [lwa][/s2If] [s2If current_user_can(access_s2member_level1)]
- USD/CAD meets with a fresh supply on Tuesday and is weighed down by a combination of factors.
The pair currently trades last at 1.32640.
The previous day high was 1.3304 while the previous day low was 1.3268. The daily 38.2% Fib levels comes at 1.3291, expected to provide resistance. Similarly, the daily 61.8% fib level is at 1.3282, expected to provide resistance.
The USD/CAD pair comes under some renewed selling pressure following the previous day’s modest bounce and hits a four-day low, around the 1.3250 area during the Asian session on Tuesday.
Crude Oil prices regain some positive traction and reverse a part of Monday’s pullback from a five-week high, which, in turn, is seen underpinning the commodity-linked Loonie. The US Dollar (USD), on the other hand, prolongs its descending trend for the fourth straight day and drops to a two-month low. This contributes to the offered tone surrounding the USD/CAD pair and supports prospects for further losses.
From a technical perspective, last week’s failure near the 50-day Simple Moving Average (SMA) and the subsequent sharp pullback from the 1.3385 region, or a one-month peak, favour bearish traders. Moreover, oscillators on the daily chart have again started gaining negative traction and add credence to the negative outlook, suggesting that the path of least resistance for the USD/CAD pair is to the downside.
Hence, some follow-through decline towards testing the next relevant support near the 1.3225-1.3220 area, en route to the 1.3200 mark, or the monthly low touched last week, looks like a distinct possibility. A convincing break below the latter could make the USD/CAD pair vulnerable to weaken further below the 1.3145 intermediate support and challenge the YTD low, around the 1.3115 area touched in June.
On the flip side, the overnight swing high, around 1.3300 round figure now seems to act as an immediate hurdle. A sustained move beyond might trigger a short-covering move and lift the USD/CAD pair back towards the 50-day SMA resistance, currently around the 1.3375-1.3380 region. This is closely followed by the 1.3400 mark, which if cleared decisively will shift the near-term bias in favour of bullish traders.
Technical Levels: Supports and Resistances
USDCAD currently trading at 1.3264 at the time of writing. Pair opened at 1.328 and is trading with a change of -0.12 % .
| Overview | Overview.1 | |
|---|---|---|
| 0 | Today last price | 1.3264 |
| 1 | Today Daily Change | -0.0016 |
| 2 | Today Daily Change % | -0.1200 |
| 3 | Today daily open | 1.3280 |
The pair is trading above its 20 Daily moving average @ 1.3239, below its 50 Daily moving average @ 1.3386 , below its 100 Daily moving average @ 1.3487 and below its 200 Daily moving average @ 1.3501
| Trends | Trends.1 | |
|---|---|---|
| 0 | Daily SMA20 | 1.3239 |
| 1 | Daily SMA50 | 1.3386 |
| 2 | Daily SMA100 | 1.3487 |
| 3 | Daily SMA200 | 1.3501 |
The previous day high was 1.3304 while the previous day low was 1.3268. The daily 38.2% Fib levels comes at 1.3291, expected to provide resistance. Similarly, the daily 61.8% fib level is at 1.3282, expected to provide resistance.
Note the levels of interest below:
- Pivot support is noted at 1.3265, 1.3249, 1.3229
- Pivot resistance is noted at 1.33, 1.332, 1.3336
| Levels | Levels.1 |
|---|---|
| Previous Daily High | 1.3304 |
| Previous Daily Low | 1.3268 |
| Previous Weekly High | 1.3387 |
| Previous Weekly Low | 1.3203 |
| Previous Monthly High | 1.3585 |
| Previous Monthly Low | 1.3117 |
| Daily Fibonacci 38.2% | 1.3291 |
| Daily Fibonacci 61.8% | 1.3282 |
| Daily Pivot Point S1 | 1.3265 |
| Daily Pivot Point S2 | 1.3249 |
| Daily Pivot Point S3 | 1.3229 |
| Daily Pivot Point R1 | 1.3300 |
| Daily Pivot Point R2 | 1.3320 |
| Daily Pivot Point R3 | 1.3336 |
[/s2If]
Download Nehcap EAWe have two EAs that are operational on our LIVE accounts.
- EA-FIX: Check out the details here. Download EA-FIX . EA-FIX is a non-grid HFT scalper.
- EA-GROWTH: High quality low dd EA using trend grids. Download EA_GROWTHJoin Our Telegram Group
")


