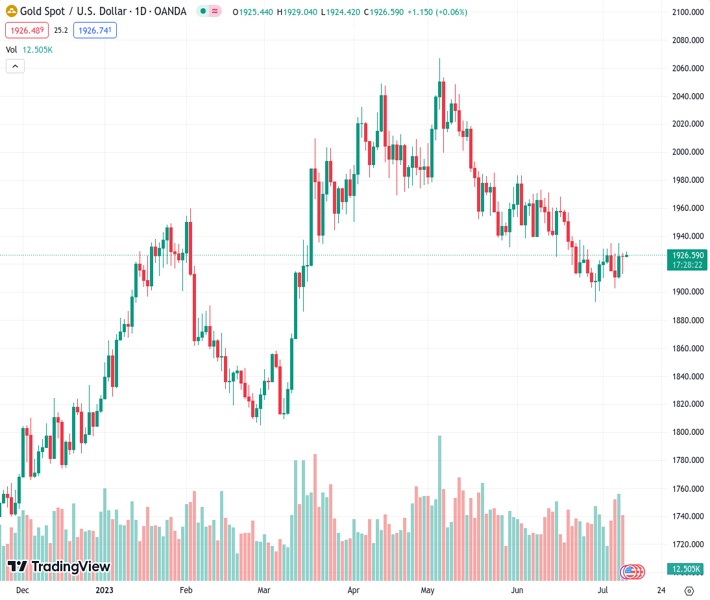
The price of gold, which is marked as XAUUSD at 1,926.70, increases on Tuesday due to the widespread selling of the US Dollar.
…
This is a premium post.
[s2If !current_user_can(access_s2member_level4)]Please register for FREE REGISTER to read full post below containing analysis. In case of any error or you think you are not able to read the full post below, please email us at support#nehcap.com [lwa][/s2If] [s2If current_user_can(access_s2member_level1)]
- Gold price ticks higher on Tuesday and is supported by the prevalent US Dollar selling bias.
The pair currently trades last at 1926.70.
The previous day high was 1928.18 while the previous day low was 1912.74. The daily 38.2% Fib levels comes at 1922.28, expected to provide support. Similarly, the daily 61.8% fib level is at 1918.64, expected to provide support.
Gold price edges higher during the Asian session on Tuesday, albeit lacks bullish conviction and remains well below a key hurdle near the $1,935 area tested last week. The XAU/USD currently trades just above the $1,925 level, up less than 0.10% for the day, as traders keenly await the release of the latest consumer inflation figures from the United States (USD), due on Wednesday, before placing fresh directional bets.
The crucial US Consumer Price Index (CPI) will play a key role in influencing the Federal Reserve’s (Fed) near-term policy outlook, which, in turn, will drive the US Dollar (USD) demand and provide some meaningful impetus to the Gold price. In the meantime, speculations that the US central bank is nearing the end of its policy tightening drag the USD lower for the fourth straight day, to its lowest level since May 11 and act as a tailwind for the US Dollar-denominated metal. The US monthly employment details released on Friday showed that the economy added the fewest jobs in 2-1/2 years, signalling that the labor market is cooling. Furthermore, the New York Fes’s monthly survey revealed on Monday that the one-year consumer inflation expectation dropped to the lowest level since April 2021, to 3.8% in June from 4.1% in the previous month. This could allow the Fed to soften its hawkish stance and continues to weigh on the Greenback.
Apart from this, worries about a global economic downturn lend additional support to the safe-haven XAU/USD, though the intraday uptick lacks bullish conviction. The overnight hawkish comments by several Fed officials reaffirm market bets for a 25 basis points (bps) lift-off at the upcoming Federal Open Market Committee (FOMC) policy meeting on July 25-26. This, in turn, is seen as a key factor acting as a headwind for the non-yielding Gold price. In fact, San Francisco Fed President Mary Daly said during an event at the Brookings Institution that the risks of doing too little are still greater than those of overdoing it on rate hikes. Adding to this, Cleveland Fed President Loretta Mester reiterated that the US central bank will need to tighten the monetary policy further to lower inflation. This, in turn, makes it prudent to wait for strong follow-through buying before positioning for any meaningful appreciating move for the Gold price.
From a technical perspective, any subsequent move up might continue to confront stiff resistance near the $1,933-$1,935 supply zone. This is followed by the 100-day Simple Moving Average (SMA), currently around the $1,948-$1,949 region. A sustained strength beyond the latter might trigger a short-covering rally and lift the Gold price to the $1,962-$1,964 area en route to the $1,970-$1,972 supply zone. The momentum could get extended further, allowing bulls to reclaim the $2,000 psychological mark and testing the $2,010-$2,012 resistance.
On the flip side, the $1,912-$1,910 area seems to have emerged as an immediate support and should protect the downside ahead of the $1,900 mark and the multi-month low, around the $1,893-$1,892 region touched in June. Some follow-through selling will be seen as a fresh trigger for bearish traders and make the Gold price vulnerable to accelerate the downward trajectory towards the very important 200-day Simple Moving Average (SMA), currently around the $1,866-$1,865 zone. The latter should act as a pivotal point, which if broken decisively should pave the way for an extension of the recent sharp retracement slide from the all-time high, around the $2,080 region touched in May.
Technical Levels: Supports and Resistances
XAUUSD currently trading at 1927.89 at the time of writing. Pair opened at 1925.29 and is trading with a change of 0.14 % .
| Overview | Overview.1 | |
|---|---|---|
| 0 | Today last price | 1927.89 |
| 1 | Today Daily Change | 2.60 |
| 2 | Today Daily Change % | 0.14 |
| 3 | Today daily open | 1925.29 |
The pair is trading above its 20 Daily moving average @ 1927.58, below its 50 Daily moving average @ 1960.85 , below its 100 Daily moving average @ 1948.83 and above its 200 Daily moving average @ 1867.66
| Trends | Trends.1 | |
|---|---|---|
| 0 | Daily SMA20 | 1927.58 |
| 1 | Daily SMA50 | 1960.85 |
| 2 | Daily SMA100 | 1948.83 |
| 3 | Daily SMA200 | 1867.66 |
The previous day high was 1928.18 while the previous day low was 1912.74. The daily 38.2% Fib levels comes at 1922.28, expected to provide support. Similarly, the daily 61.8% fib level is at 1918.64, expected to provide support.
Note the levels of interest below:
- Pivot support is noted at 1915.96, 1906.63, 1900.52
- Pivot resistance is noted at 1931.4, 1937.51, 1946.84
| Levels | Levels.1 |
|---|---|
| Previous Daily High | 1928.18 |
| Previous Daily Low | 1912.74 |
| Previous Weekly High | 1935.09 |
| Previous Weekly Low | 1902.77 |
| Previous Monthly High | 1983.50 |
| Previous Monthly Low | 1893.01 |
| Daily Fibonacci 38.2% | 1922.28 |
| Daily Fibonacci 61.8% | 1918.64 |
| Daily Pivot Point S1 | 1915.96 |
| Daily Pivot Point S2 | 1906.63 |
| Daily Pivot Point S3 | 1900.52 |
| Daily Pivot Point R1 | 1931.40 |
| Daily Pivot Point R2 | 1937.51 |
| Daily Pivot Point R3 | 1946.84 |
[/s2If]
Download Nehcap EAWe have two EAs that are operational on our LIVE accounts.
- EA-FIX: Check out the details here. Download EA-FIX . EA-FIX is a non-grid HFT scalper.
- EA-GROWTH: High quality low dd EA using trend grids. Download EA_GROWTHJoin Our Telegram Group
")


