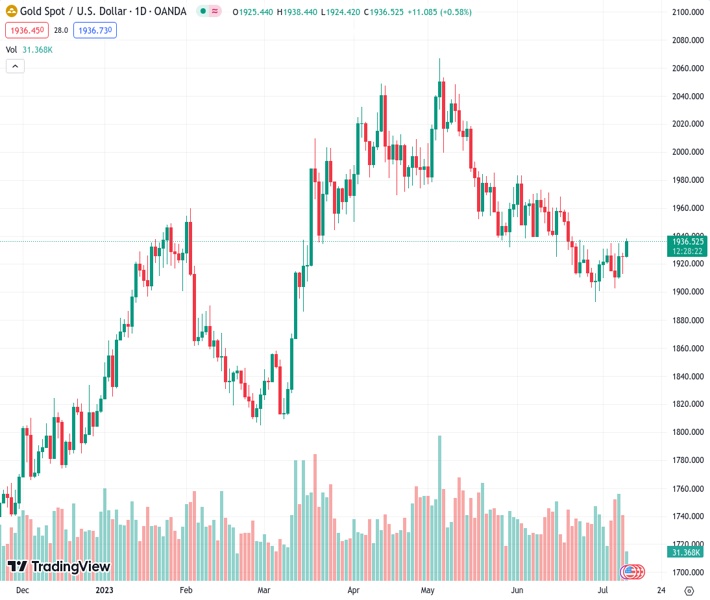
The price of gold, represented by #XAUUSD at 1,936.48, has rebounded following a small corrective decline due to a lack of interest in the USD Index.
…
This is a premium post.
[s2If !current_user_can(access_s2member_level4)]Please register for FREE REGISTER to read full post below containing analysis. In case of any error or you think you are not able to read the full post below, please email us at support#nehcap.com [lwa][/s2If] [s2If current_user_can(access_s2member_level1)]
- Gold price has recovered after a minor corrective move amid a weak appeal for the USD Index.
The pair currently trades last at 1936.48.
The previous day high was 1928.18 while the previous day low was 1912.74. The daily 38.2% Fib levels comes at 1922.28, expected to provide support. Similarly, the daily 61.8% fib level is at 1918.64, expected to provide support.
Gold price (XAU/USD) has resumed its upside journey after a marginal correction to near $1,930.00 in the London session. The precious metal has found support as the US Dollar Index (DXY) is under extreme pressure ahead of Wednesday’s Consumer Price Index (CPI) data, which will be published at 12:30 GMT.
S&P500 futures have added some gains in Europe, following positive cues observed on Monday. Market sentiment is extremely bullish as investors have shrugged-off uncertainty associated with upcoming corporate earnings for major banks this week.
The US Dollar Index (DXY) has found intermediate support near 101.68. More downside in the USD Index seems favored as tight labor market conditions are releasing heat and inflationary pressures are expected to cool down further amid a decline in gasoline prices. The 10-year US Treasury yields have further dropped to near 3.96%.
As per the preliminary report, annualized headline CPI is expected to decelerate to 3.1% against the former release of 4.0%, and core inflation is seen softening to 5.0% vs. May’s figure of 5.3% in a similar period. Meanwhile, San Francisco Fed Bank President Mary Daly reiterated on Monday that she believes two more rate hikes this year will likely be needed to bring down too-high inflation in the face of a strong labor market.
Gold price is on the verge of delivering a breakout of the Inverted Head and Shoulder chart pattern formed on a two-hour scale. A breakout of the aforementioned chart pattern will result in a bullish reversal. The neckline of the chart pattern is plotted around June 21 high at $1,935.00.
The 50-period Exponential Moving Average (EMA) at $1,923.43 is providing a cushion to the Gold bulls.
Meanwhile, the Relative Strength Index (RSI) (14) has jumped into the bullish range of 60.00-80.00, which indicates that the bullish momentum has been triggered.
Technical Levels: Supports and Resistances
XAUUSD currently trading at 1934.31 at the time of writing. Pair opened at 1925.29 and is trading with a change of 0.47 % .
| Overview | Overview.1 | |
|---|---|---|
| 0 | Today last price | 1934.31 |
| 1 | Today Daily Change | 9.02 |
| 2 | Today Daily Change % | 0.47 |
| 3 | Today daily open | 1925.29 |
The pair is trading above its 20 Daily moving average @ 1927.58, below its 50 Daily moving average @ 1960.85 , below its 100 Daily moving average @ 1948.83 and above its 200 Daily moving average @ 1867.66
| Trends | Trends.1 | |
|---|---|---|
| 0 | Daily SMA20 | 1927.58 |
| 1 | Daily SMA50 | 1960.85 |
| 2 | Daily SMA100 | 1948.83 |
| 3 | Daily SMA200 | 1867.66 |
The previous day high was 1928.18 while the previous day low was 1912.74. The daily 38.2% Fib levels comes at 1922.28, expected to provide support. Similarly, the daily 61.8% fib level is at 1918.64, expected to provide support.
Note the levels of interest below:
- Pivot support is noted at 1915.96, 1906.63, 1900.52
- Pivot resistance is noted at 1931.4, 1937.51, 1946.84
| Levels | Levels.1 |
|---|---|
| Previous Daily High | 1928.18 |
| Previous Daily Low | 1912.74 |
| Previous Weekly High | 1935.09 |
| Previous Weekly Low | 1902.77 |
| Previous Monthly High | 1983.50 |
| Previous Monthly Low | 1893.01 |
| Daily Fibonacci 38.2% | 1922.28 |
| Daily Fibonacci 61.8% | 1918.64 |
| Daily Pivot Point S1 | 1915.96 |
| Daily Pivot Point S2 | 1906.63 |
| Daily Pivot Point S3 | 1900.52 |
| Daily Pivot Point R1 | 1931.40 |
| Daily Pivot Point R2 | 1937.51 |
| Daily Pivot Point R3 | 1946.84 |
[/s2If]
Download Nehcap EAWe have two EAs that are operational on our LIVE accounts.
- EA-FIX: Check out the details here. Download EA-FIX . EA-FIX is a non-grid HFT scalper.
- EA-GROWTH: High quality low dd EA using trend grids. Download EA_GROWTHJoin Our Telegram Group
")


