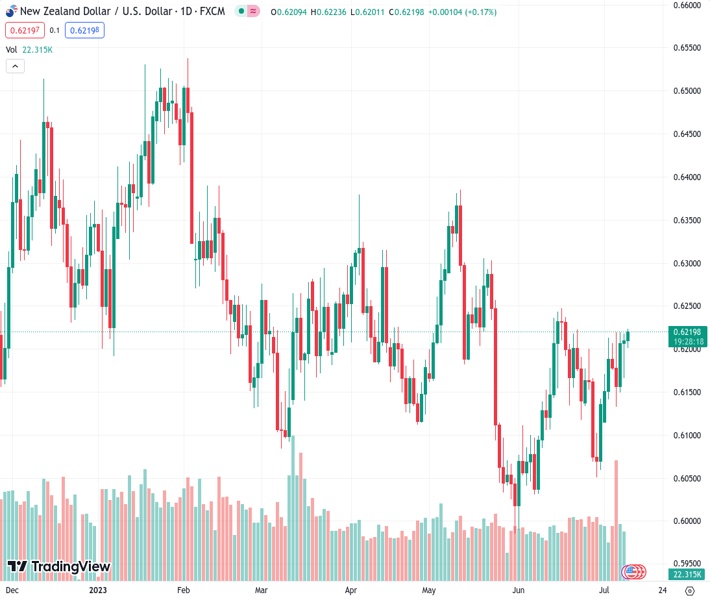
The NZDUSD currency pair remains stable close to a high point lasting several weeks on Tuesday, primarily due to a decline in the value of the US dollar.
…
This is a premium post.
[s2If !current_user_can(access_s2member_level4)]Please register for FREE REGISTER to read full post below containing analysis. In case of any error or you think you are not able to read the full post below, please email us at support#nehcap.com [lwa][/s2If] [s2If current_user_can(access_s2member_level1)]
- NZD/USD holds steady near a multi-week high on Tuesday amid a weaker USD.
The pair currently trades last at 0.62191.
The previous day high was 0.622 while the previous day low was 0.6166. The daily 38.2% Fib levels comes at 0.6199, expected to provide support. Similarly, the daily 61.8% fib level is at 0.6187, expected to provide support.
The NZD/USD pair edges higher for the third successive day on Tuesday and trades around the 0.6215-0.6220 barrier or a nearly three-week high during the Asian session.
Expectations that the Federal Reserve (Fed) might be nearing the end of its rate hiking cycle keep the US Dollar (USD) bulls on the defensive, which, in turn, acts as a tailwind for the NZD/USD pair. Market participants, however, seem reluctant to place aggressive bets ahead of the key central bank event risk – the Reserve Bank of New Zealand (RBNZ) policy meeting – and the release of the key US CPI report on Wednesday.
From a technical perspective, the recent breakout through a confluence resistance comprising the 100-day Simple Moving Average (SMA) and a descending trend-line suggests that the path of least resistance for the NZD/USD pair is to the upside. Adding to this, oscillators on the daily chart have just started gaining positive traction and validate the constructive setup, supporting prospects for further near-term gains.
That said, it will still be prudent to wait for some follow-through buying beyond the June monthly peak, around the 0.6245-0.6250 region, which coincides with the 61.8% Fibonacci retracement level of the May-June downfall, before placing fresh bullish bets. The NZD/USD pair might then accelerate the momentum towards testing the 0.6285 intermediate hurdle before aiming to reclaim the 0.6300 round-figure mark.
On the flip side, the 0.6190-0.6185 confluence resistance breakpoint now seems to protect the immediate downside ahead of the 38.2% Fibo. level, around the 0.6140-0.6135 region. Any subsequent decline could attract some buying and remain cushioned near the 0.6100 mark. This is closely followed by 23.6% Fibo. level, around the 0.6080 region, below which the NZD/USD pair could slide to the 0.6000 psychological mark.
Some follow-through selling below the YTD low, around the 0.5985 zone touched in June, should pave the way for a further near-term depreciating move.
Technical Levels: Supports and Resistances
NZDUSD currently trading at 0.6217 at the time of writing. Pair opened at 0.6211 and is trading with a change of 0.1 % .
| Overview | Overview.1 | |
|---|---|---|
| 0 | Today last price | 0.6217 |
| 1 | Today Daily Change | 0.0006 |
| 2 | Today Daily Change % | 0.1000 |
| 3 | Today daily open | 0.6211 |
The pair remains strongly bullish on the daily timeframe. It trades above its 20 SMA @ 0.6167, 50 SMA 0.617, 100 SMA @ 0.6188 and 200 SMA @ 0.6177.
| Trends | Trends.1 | |
|---|---|---|
| 0 | Daily SMA20 | 0.6167 |
| 1 | Daily SMA50 | 0.6170 |
| 2 | Daily SMA100 | 0.6188 |
| 3 | Daily SMA200 | 0.6177 |
The previous day high was 0.622 while the previous day low was 0.6166. The daily 38.2% Fib levels comes at 0.6199, expected to provide support. Similarly, the daily 61.8% fib level is at 0.6187, expected to provide support.
Note the levels of interest below:
- Pivot support is noted at 0.6178, 0.6145, 0.6124
- Pivot resistance is noted at 0.6232, 0.6253, 0.6286
| Levels | Levels.1 |
|---|---|
| Previous Daily High | 0.6220 |
| Previous Daily Low | 0.6166 |
| Previous Weekly High | 0.6221 |
| Previous Weekly Low | 0.6124 |
| Previous Monthly High | 0.6250 |
| Previous Monthly Low | 0.5990 |
| Daily Fibonacci 38.2% | 0.6199 |
| Daily Fibonacci 61.8% | 0.6187 |
| Daily Pivot Point S1 | 0.6178 |
| Daily Pivot Point S2 | 0.6145 |
| Daily Pivot Point S3 | 0.6124 |
| Daily Pivot Point R1 | 0.6232 |
| Daily Pivot Point R2 | 0.6253 |
| Daily Pivot Point R3 | 0.6286 |
[/s2If]
Download Nehcap EAWe have two EAs that are operational on our LIVE accounts.
- EA-FIX: Check out the details here. Download EA-FIX . EA-FIX is a non-grid HFT scalper.
- EA-GROWTH: High quality low dd EA using trend grids. Download EA_GROWTHJoin Our Telegram Group
")


