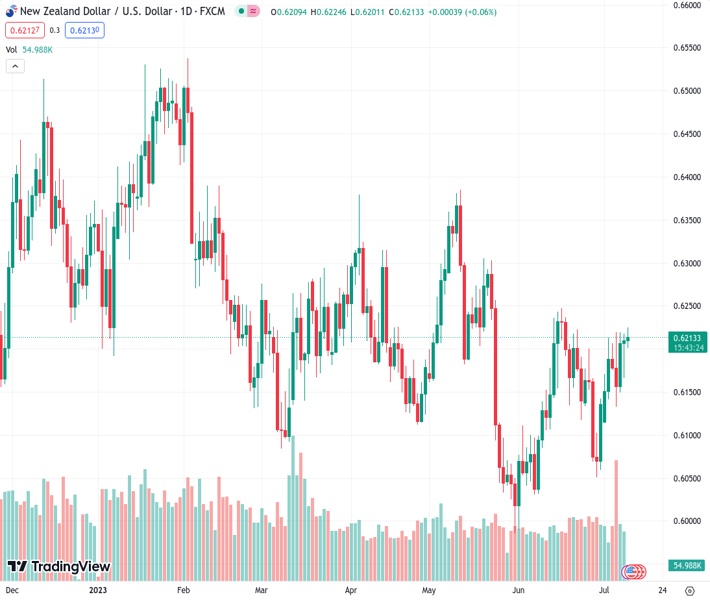
The NZDUSD currency pair is finding it difficult to maintain the upward trend it has been experiencing for the past three days. It is currently facing resistance at the highest level for the month and has started to decline from its recent peak.
…
This is a premium post.
[s2If !current_user_can(access_s2member_level4)]Please register for FREE REGISTER to read full post below containing analysis. In case of any error or you think you are not able to read the full post below, please email us at support#nehcap.com [lwa][/s2If] [s2If current_user_can(access_s2member_level1)]
- NZD/USD struggles to defend three-day uptrend at monthly top, retreats from recent peak of late.
The pair currently trades last at 0.62148.
The previous day high was 0.622 while the previous day low was 0.6166. The daily 38.2% Fib levels comes at 0.6199, expected to provide support. Similarly, the daily 61.8% fib level is at 0.6187, expected to provide support.
NZD/USD pares intraday gains around 0.6215-10 as it reverses from the highest levels in three weeks heading into Tuesday’s European session. In doing so, the Kiwi pair struggles to defend the three-day uptrend amid the market’s cautious mood ahead of Wednesday’s Reserve Bank of New Zealand (RBNZ) Interest Rate Decision and the US inflation data for June per the Consumer Price Index (CPI) indicator.
It’s worth noting that the US Dollar renews a two-month low of around 101.75 by the press time as market players fear downbeat US inflation data and challenges for the Federal Reserve’s (Fed) further rate hikes, especially after Friday’s disappointment from the US jobs report.
The fears of softer US inflation gained momentum on Monday after the New York Federal Reserve’s (Fed) monthly inflation expectations survey suggested the US consumers’ one-year inflation expectation dropped to the lowest level since April 2021 at 3.8% in June from 4.1% in May. Previously, the US Nonfarm Payrolls (NFP) marked the first below-expectations print in 15 months and drowned the US Dollar to make it post the biggest daily loss in three weeks.
On the other hand, Monday’s downbeat China inflation joined the market’s fears of the RBNZ’s inaction, after consecutive rate hikes since October 2021, to prod the NZD/USD buyers amid sluggish market sentiment.
While portraying the mood, the S&P500 Futures seesaw around 4,445, up 0.05% intraday, struggling to extend the previous day’s recovery from the lowest level since June 29. That said, the US Treasury bond yields remain pressured after reversing from the highest level since March on Monday. It should be noted that the benchmark US 10-year Treasury bond yields printed the first daily loss in July the previous day whereas the two-year counterpart declined for the second consecutive day, to respectively near 3.99% and 4.85% at the latest.
Moving on, a light calendar and chatters about the US-China tension may join the hawkish Fed talks to prod the NZD/USD bulls ahead of the key RBNZ. Should New Zealand’s central bank surprise markets with a rate hike, even of 0.25%, the Kiwi pair may rally towards the late May swing high. Even if it doesn’t, downbeat US inflation data can keep the quote firmer.
Despite the latest pullback, the NZD/USD pair buyers remain hopeful unless the quote stays beyond a convergence of the 100-DMA and the previous resistance line from May 19, close to 0.6185-80 by the press time.
Technical Levels: Supports and Resistances
NZDUSD currently trading at 0.6214 at the time of writing. Pair opened at 0.6211 and is trading with a change of 0.05% % .
| Overview | Overview.1 | |
|---|---|---|
| 0 | Today last price | 0.6214 |
| 1 | Today Daily Change | 0.0003 |
| 2 | Today Daily Change % | 0.05% |
| 3 | Today daily open | 0.6211 |
The pair remains strongly bullish on the daily timeframe. It trades above its 20 SMA @ 0.6167, 50 SMA 0.617, 100 SMA @ 0.6188 and 200 SMA @ 0.6177.
| Trends | Trends.1 | |
|---|---|---|
| 0 | Daily SMA20 | 0.6167 |
| 1 | Daily SMA50 | 0.6170 |
| 2 | Daily SMA100 | 0.6188 |
| 3 | Daily SMA200 | 0.6177 |
The previous day high was 0.622 while the previous day low was 0.6166. The daily 38.2% Fib levels comes at 0.6199, expected to provide support. Similarly, the daily 61.8% fib level is at 0.6187, expected to provide support.
Note the levels of interest below:
- Pivot support is noted at 0.6178, 0.6145, 0.6124
- Pivot resistance is noted at 0.6232, 0.6253, 0.6286
| Levels | Levels.1 |
|---|---|
| Previous Daily High | 0.6220 |
| Previous Daily Low | 0.6166 |
| Previous Weekly High | 0.6221 |
| Previous Weekly Low | 0.6124 |
| Previous Monthly High | 0.6250 |
| Previous Monthly Low | 0.5990 |
| Daily Fibonacci 38.2% | 0.6199 |
| Daily Fibonacci 61.8% | 0.6187 |
| Daily Pivot Point S1 | 0.6178 |
| Daily Pivot Point S2 | 0.6145 |
| Daily Pivot Point S3 | 0.6124 |
| Daily Pivot Point R1 | 0.6232 |
| Daily Pivot Point R2 | 0.6253 |
| Daily Pivot Point R3 | 0.6286 |
[/s2If]
Download Nehcap EAWe have two EAs that are operational on our LIVE accounts.
- EA-FIX: Check out the details here. Download EA-FIX . EA-FIX is a non-grid HFT scalper.
- EA-GROWTH: High quality low dd EA using trend grids. Download EA_GROWTHJoin Our Telegram Group
")


