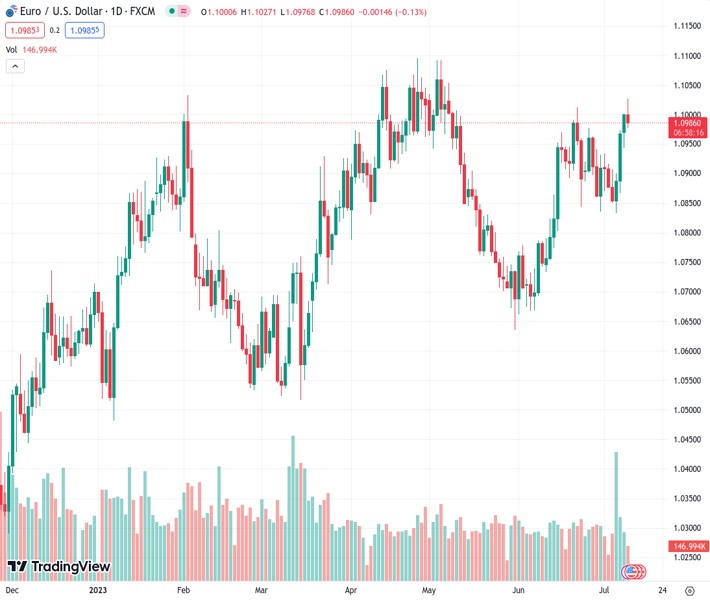
The EURUSD currency pair, which was initially showing a bullish trend towards the 1.1030 area, has started to lose momentum.
…
This is a premium post.
[s2If !current_user_can(access_s2member_level4)]Please register for FREE REGISTER to read full post below containing analysis. In case of any error or you think you are not able to read the full post below, please email us at support#nehcap.com [lwa][/s2If] [s2If current_user_can(access_s2member_level1)]
- EUR/USD fades the initial bull run to the 1.1030 region.
The pair currently trades last at 1.09869.
The previous day high was 1.1002 while the previous day low was 1.0944. The daily 38.2% Fib levels comes at 1.0979, expected to provide support. Similarly, the daily 61.8% fib level is at 1.0966, expected to provide support.
EUR/USD retreats from earlier monthly tops north of the psychological 1.1000 mark on Tuesday.
The surpass of the July high at 1.1027 should put the pair en route to a challenge of the 2023 high at 1.1095 (April 26) just ahead of the round level at 1.1100.
Looking at the longer run, the positive view remains unchanged while above the 200-day SMA, today at 1.0630.
Technical Levels: Supports and Resistances
EURUSD currently trading at 1.0982 at the time of writing. Pair opened at 1.1001 and is trading with a change of -0.17 % .
| Overview | Overview.1 | |
|---|---|---|
| 0 | Today last price | 1.0982 |
| 1 | Today Daily Change | 51.0000 |
| 2 | Today Daily Change % | -0.1700 |
| 3 | Today daily open | 1.1001 |
The pair remains strongly bullish on the daily timeframe. It trades above its 20 SMA @ 1.0912, 50 SMA 1.086, 100 SMA @ 1.0832 and 200 SMA @ 1.0627.
| Trends | Trends.1 | |
|---|---|---|
| 0 | Daily SMA20 | 1.0912 |
| 1 | Daily SMA50 | 1.0860 |
| 2 | Daily SMA100 | 1.0832 |
| 3 | Daily SMA200 | 1.0627 |
The previous day high was 1.1002 while the previous day low was 1.0944. The daily 38.2% Fib levels comes at 1.0979, expected to provide support. Similarly, the daily 61.8% fib level is at 1.0966, expected to provide support.
Note the levels of interest below:
- Pivot support is noted at 1.0963, 1.0924, 1.0905
- Pivot resistance is noted at 1.1021, 1.104, 1.1079
| Levels | Levels.1 |
|---|---|
| Previous Daily High | 1.1002 |
| Previous Daily Low | 1.0944 |
| Previous Weekly High | 1.0973 |
| Previous Weekly Low | 1.0834 |
| Previous Monthly High | 1.1012 |
| Previous Monthly Low | 1.0662 |
| Daily Fibonacci 38.2% | 1.0979 |
| Daily Fibonacci 61.8% | 1.0966 |
| Daily Pivot Point S1 | 1.0963 |
| Daily Pivot Point S2 | 1.0924 |
| Daily Pivot Point S3 | 1.0905 |
| Daily Pivot Point R1 | 1.1021 |
| Daily Pivot Point R2 | 1.1040 |
| Daily Pivot Point R3 | 1.1079 |
[/s2If]
Download Nehcap EAWe have two EAs that are operational on our LIVE accounts.
- EA-FIX: Check out the details here. Download EA-FIX . EA-FIX is a non-grid HFT scalper.
- EA-GROWTH: High quality low dd EA using trend grids. Download EA_GROWTHJoin Our Telegram Group
")


