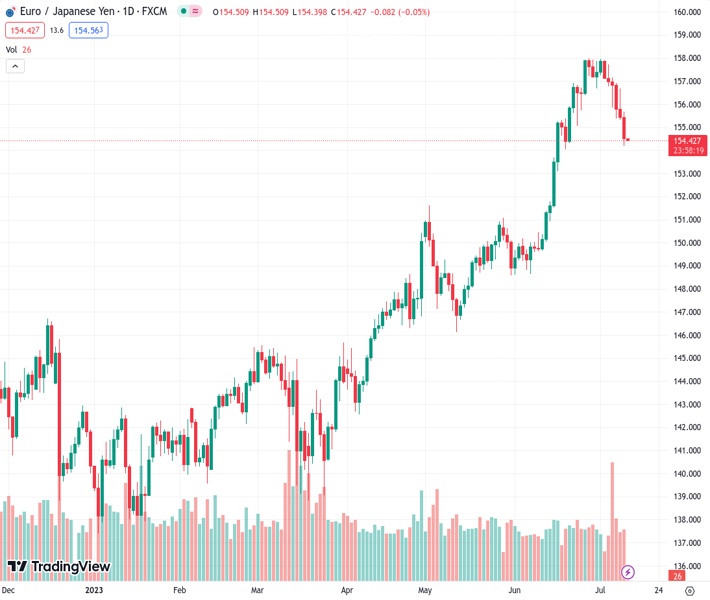
The EURJPY pair, currently at a rate of 154.504, is continuing to move downwards and has now dropped below the 154.50 level. This decline is supported by the negative readings of the technical indicators.
…
This is a premium post.
[s2If !current_user_can(access_s2member_level4)]Please register for FREE REGISTER to read full post below containing analysis. In case of any error or you think you are not able to read the full post below, please email us at support#nehcap.com [lwa][/s2If] [s2If current_user_can(access_s2member_level1)]
- EUR/JPY continues its downward trajectory falling below the 154.50 level as technical indicators stand in the red.
The pair currently trades last at 154.504.
The previous day high was 156.67 while the previous day low was 155.33. The daily 38.2% Fib levels comes at 155.84, expected to provide resistance. Similarly, the daily 61.8% fib level is at 156.16, expected to provide resistance.
In Tuesday’s session, the EUR/JPY cross continued its downward path as the Yen strengthened agains its major rivals. On the other hand, poor ZEW survey data seems to make the Euro difficult to find demand.
Despite markets expecting the Bank of Japan (BoJ) to maintain its monetary policy unchanged in its July meeting, economists at Rabobank believe they will offer some signal of when the policy may be adjusted with the adjusted macroeconomic forecast. As for now, wages, which the bank closely watches, increased in May in Japan so all eyes will be on the next set of economic activity data. Also, China’s Trade Balance data on Thursdays will be the focus as it is one of Japan’s main trading partners.
In that sense, on Wednesday, the May Machine orders report will be published, and analysts predict a 0.1% year-on-year growth, which is an improvement compared to April’s decline of -5.9%. Additionally, the June Producer Price Index (PPI) data is expected to be released, indicating a year-on-year rate of 4.3%, lower than the previous rate of 5.1%.
On the Euro’s side, Germany reported soft ZEW July data. The Expectations Survey came in at -14.7 vs -10.6 expected, the Current Situation at -59.5, slightly above the consensus of -60.00 and overall, market sentiment is deteriorating as Germany slips into a recession.
The current analysis of the daily chart suggests a shift towards a bearish outlook in the short term as selling pressure escalates. The Relative Strength Index (RSI) has fallen into negative territory for the first time since March, and the Moving Average Convergence Divergence (MACD) prints growing red bars indicating the bears are in command.
Support Levels: 154.00,153.40,153.00.
Resistance Levels: 156.00 (20-day Simple Moving Average),156.50, 157.00.
Technical Levels: Supports and Resistances
EURJPY currently trading at 154.51 at the time of writing. Pair opened at 155.46 and is trading with a change of -0.61 % .
| Overview | Overview.1 | |
|---|---|---|
| 0 | Today last price | 154.51 |
| 1 | Today Daily Change | -0.95 |
| 2 | Today Daily Change % | -0.61 |
| 3 | Today daily open | 155.46 |
The pair is trading below its 20 Daily moving average @ 155.9, above its 50 Daily moving average @ 151.86 , above its 100 Daily moving average @ 148.26 and above its 200 Daily moving average @ 145.68
| Trends | Trends.1 | |
|---|---|---|
| 0 | Daily SMA20 | 155.90 |
| 1 | Daily SMA50 | 151.86 |
| 2 | Daily SMA100 | 148.26 |
| 3 | Daily SMA200 | 145.68 |
The previous day high was 156.67 while the previous day low was 155.33. The daily 38.2% Fib levels comes at 155.84, expected to provide resistance. Similarly, the daily 61.8% fib level is at 156.16, expected to provide resistance.
Note the levels of interest below:
- Pivot support is noted at 154.97, 154.48, 153.62
- Pivot resistance is noted at 156.32, 157.17, 157.66
| Levels | Levels.1 |
|---|---|
| Previous Daily High | 156.67 |
| Previous Daily Low | 155.33 |
| Previous Weekly High | 157.96 |
| Previous Weekly Low | 155.38 |
| Previous Monthly High | 158.00 |
| Previous Monthly Low | 148.62 |
| Daily Fibonacci 38.2% | 155.84 |
| Daily Fibonacci 61.8% | 156.16 |
| Daily Pivot Point S1 | 154.97 |
| Daily Pivot Point S2 | 154.48 |
| Daily Pivot Point S3 | 153.62 |
| Daily Pivot Point R1 | 156.32 |
| Daily Pivot Point R2 | 157.17 |
| Daily Pivot Point R3 | 157.66 |
[/s2If]
Download Nehcap EAWe have two EAs that are operational on our LIVE accounts.
- EA-FIX: Check out the details here. Download EA-FIX . EA-FIX is a non-grid HFT scalper.
- EA-GROWTH: High quality low dd EA using trend grids. Download EA_GROWTHJoin Our Telegram Group
")


