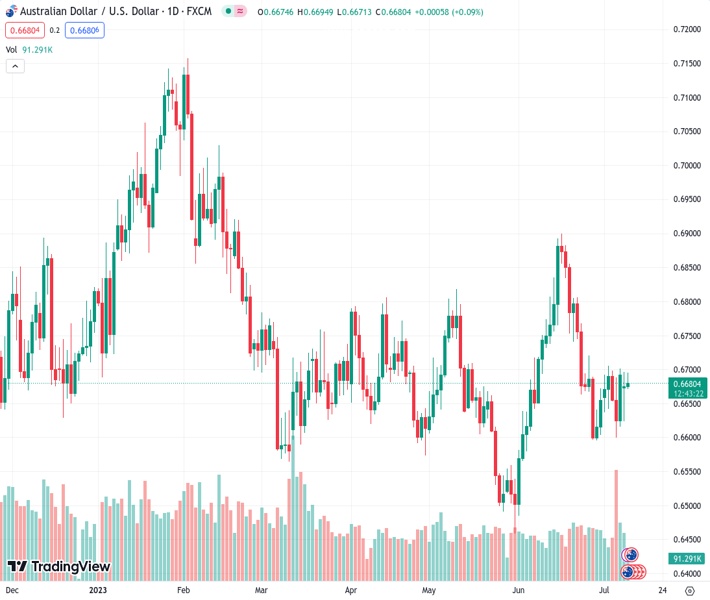
The AUDUSD pair, currently at 0.66807, has once again been unable to surpass the 200-day SMA resistance near the 0.6700 level.
…
This is a premium post.
[s2If !current_user_can(access_s2member_level4)]Please register for FREE REGISTER to read full post below containing analysis. In case of any error or you think you are not able to read the full post below, please email us at support#nehcap.com [lwa][/s2If] [s2If current_user_can(access_s2member_level1)]
- AUD/USD once again fails ahead of the 200-day SMA barrier near the 0.6700 mark.
The pair currently trades last at 0.66807.
The previous day high was 0.6696 while the previous day low was 0.6624. The daily 38.2% Fib levels comes at 0.6651, expected to provide support. Similarly, the daily 61.8% fib level is at 0.6668, expected to provide support.
The AUD/USD pair continues with its struggle to make it through the very important 200-day Simple Moving Average (SMA) and attracts some intraday selling in the vicinity of the 0.6700 mark on Tuesday. Spot prices retreat to the lower end of the daily range, around the 0.6680-0.6675 region, though lack follow-through and remain well within a familiar trading band held over the past week or so.
The modest intraday pullback, meanwhile, lacks any obvious fundamental catalyst and is more likely to remain cushioned in the wake of the prevailing bearish sentiment surrounding the US Dollar (USD). Speculations that the Federal Reserve (Fed) has limited headroom to keep raising rates and is nearing the end of its rate-hiking cycle drag the USD Index (DXY), which tracks the Greenback against a basket of currencies, to a two-month low. This, in turn, should act as a tailwind for the AUD/USD pair and help limit any meaningful slide.
The closely-watched US employment details released on Friday showed that the economy added the fewest jobs in 2-1/2 years in June and indicated that the labor market is cooling. Furthermore. the New York Fed’s monthly survey revealed on Monday that the one-year consumer inflation expectation dropped to 3.8% in June – the lowest level since April 2021. This could allow the US central bank to soften its hawkish stance, which leads to a further decline in the US Treasury bond yields and continues to undermine demand for the buck.
Apart from this, a stable performance around the equity markets further dents the Greenback’s relative safe-haven status and should benefit the risk-sensitive Aussie. That said, repeated failures near a technically significant 200-day SMA make it prudent to wait for some follow-through buying before placing fresh bullish bets around the AUD/USD pair. Traders also prefer to wait on the sidelines ahead of the release of the latest US consumer inflation figures on Wednesday, which will influence the near-term USD price dynamics.
Technical Levels: Supports and Resistances
AUDUSD currently trading at 0.6673 at the time of writing. Pair opened at 0.6676 and is trading with a change of -0.04 % .
| Overview | Overview.1 | |
|---|---|---|
| 0 | Today last price | 0.6673 |
| 1 | Today Daily Change | -0.0003 |
| 2 | Today Daily Change % | -0.0400 |
| 3 | Today daily open | 0.6676 |
The pair remains strongly bearish on the daily time frame. It trades below the 20 SMA @ 0.6722, 50 SMA 0.6678, 100 SMA @ 0.6685 and 200 SMA @ 0.6698.
| Trends | Trends.1 | |
|---|---|---|
| 0 | Daily SMA20 | 0.6722 |
| 1 | Daily SMA50 | 0.6678 |
| 2 | Daily SMA100 | 0.6685 |
| 3 | Daily SMA200 | 0.6698 |
The previous day high was 0.6696 while the previous day low was 0.6624. The daily 38.2% Fib levels comes at 0.6651, expected to provide support. Similarly, the daily 61.8% fib level is at 0.6668, expected to provide support.
Note the levels of interest below:
- Pivot support is noted at 0.6634, 0.6593, 0.6562
- Pivot resistance is noted at 0.6706, 0.6737, 0.6779
| Levels | Levels.1 |
|---|---|
| Previous Daily High | 0.6696 |
| Previous Daily Low | 0.6624 |
| Previous Weekly High | 0.6705 |
| Previous Weekly Low | 0.6599 |
| Previous Monthly High | 0.6900 |
| Previous Monthly Low | 0.6484 |
| Daily Fibonacci 38.2% | 0.6651 |
| Daily Fibonacci 61.8% | 0.6668 |
| Daily Pivot Point S1 | 0.6634 |
| Daily Pivot Point S2 | 0.6593 |
| Daily Pivot Point S3 | 0.6562 |
| Daily Pivot Point R1 | 0.6706 |
| Daily Pivot Point R2 | 0.6737 |
| Daily Pivot Point R3 | 0.6779 |
[/s2If]
Download Nehcap EAWe have two EAs that are operational on our LIVE accounts.
- EA-FIX: Check out the details here. Download EA-FIX . EA-FIX is a non-grid HFT scalper.
- EA-GROWTH: High quality low dd EA using trend grids. Download EA_GROWTHJoin Our Telegram Group
")


