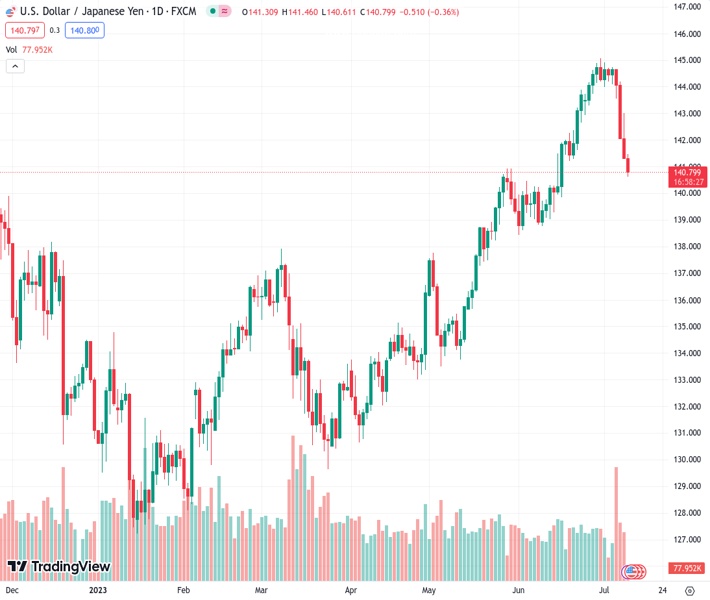
On Tuesday, the USDJPY pair, trading at 140.797, continues to decline for the fourth consecutive day and plunges to its lowest level in over three weeks.
…
This is a premium post.
[s2If !current_user_can(access_s2member_level4)]Please register for FREE REGISTER to read full post below containing analysis. In case of any error or you think you are not able to read the full post below, please email us at support#nehcap.com [lwa][/s2If] [s2If current_user_can(access_s2member_level1)]
- USD/JPY drifts lower for the fourth straight day and dives to over a three-week low on Tuesday.
The pair currently trades last at 140.797.
The previous day high was 143.0 while the previous day low was 141.28. The daily 38.2% Fib levels comes at 141.94, expected to provide resistance. Similarly, the daily 61.8% fib level is at 142.35, expected to provide resistance.
The USD/JPY pair prolongs its recent sharp retracement slide from the YTD peak – levels just above the 145.00 mark touched last week – and remains under some selling pressure for the fourth successive day on Tuesday. The downward trajectory drags spot prices to over a three-week low, closer to mid-140.00s during the Asian session and is sponsored by broad-based US Dollar (USD) weakness.
In fact, the USD Index (DXY), which tracks the Greenback against a basket of currencies, drops to a two-month low in the wake of speculations that the Federal Reserve (Fed) is nearing the end of its policy tightening cycle. The market participants now seem convinced that the US central bank will soften its hawkish stance after the expected rate hike in July. The bets were lifted by the latest US monthly jobs report released on Friday, which showed that the economy added the fewest jobs in 2-1/2 years, signalling that the labour market is cooling.
Adding to this, the New York Fed’s monthly survey revealed on Monday that the one-year consumer inflation expectation dropped to the lowest level since April 2021, to 3.8% in June from 4.1% in the previous month. This overshadows the overnight hawkish remarks by Fed officials and leads to a further decline in the US Treasury bond yields, which, in turn, is seen undermining the Greenback. The Japanese Yen (JPY), on the other hand, draws support from the recent sharp rise in Japan’s benchmark 10-year government bond yield to a 10-week high.
The aforementioned factors contribute to the offered tone surrounding the USD/JPY pair, though a more dovish stance adopted by the Bank of Japan (BoJ) might cap gains for the JPY and help limit losses. In fact, the BoJ’s negative interest-rate policy is expected to remain in place at least until next year. Furthermore, BoJ Deputy Governor Shinichi Uchida said last Friday that the central bank will maintain its yield curve control (YCC) policy from the perspective of sustaining ultra-loose monetary conditions, warranting some caution for aggressive traders.
Investors might also prefer to move to the sidelines ahead of Wednesday’s release of the latest US consumer inflation figures. The crucial US CPI report will play a key role in influencing the Fed’s near-term policy outlook, which, in turn, should drive the USD demand and provide some meaningful impetus to the USD/JPY pair. In the meantime, traders on Tuesday will take cues from the US bond yields and the USD price dynamics to grab short-term opportunities in the absence of any relevant market-moving economic releases from the US.
Technical Levels: Supports and Resistances
USDJPY currently trading at 140.85 at the time of writing. Pair opened at 141.31 and is trading with a change of -0.33 % .
| Overview | Overview.1 | |
|---|---|---|
| 0 | Today last price | 140.85 |
| 1 | Today Daily Change | -0.46 |
| 2 | Today Daily Change % | -0.33 |
| 3 | Today daily open | 141.31 |
The pair is trading below its 20 Daily moving average @ 142.86, above its 50 Daily moving average @ 139.84 , above its 100 Daily moving average @ 136.87 and above its 200 Daily moving average @ 137.21
| Trends | Trends.1 | |
|---|---|---|
| 0 | Daily SMA20 | 142.86 |
| 1 | Daily SMA50 | 139.84 |
| 2 | Daily SMA100 | 136.87 |
| 3 | Daily SMA200 | 137.21 |
The previous day high was 143.0 while the previous day low was 141.28. The daily 38.2% Fib levels comes at 141.94, expected to provide resistance. Similarly, the daily 61.8% fib level is at 142.35, expected to provide resistance.
Note the levels of interest below:
- Pivot support is noted at 140.72, 140.14, 139.0
- Pivot resistance is noted at 142.45, 143.59, 144.18
| Levels | Levels.1 |
|---|---|
| Previous Daily High | 143.00 |
| Previous Daily Low | 141.28 |
| Previous Weekly High | 144.91 |
| Previous Weekly Low | 142.07 |
| Previous Monthly High | 145.07 |
| Previous Monthly Low | 138.43 |
| Daily Fibonacci 38.2% | 141.94 |
| Daily Fibonacci 61.8% | 142.35 |
| Daily Pivot Point S1 | 140.72 |
| Daily Pivot Point S2 | 140.14 |
| Daily Pivot Point S3 | 139.00 |
| Daily Pivot Point R1 | 142.45 |
| Daily Pivot Point R2 | 143.59 |
| Daily Pivot Point R3 | 144.18 |
[/s2If]
Download Nehcap EAWe have two EAs that are operational on our LIVE accounts.
- EA-FIX: Check out the details here. Download EA-FIX . EA-FIX is a non-grid HFT scalper.
- EA-GROWTH: High quality low dd EA using trend grids. Download EA_GROWTHJoin Our Telegram Group
")


