If the GBPJPY pair manages to surpass the 182.00 level, there is a possibility of a bullish-engulfing pattern taking shape.
…
This is a premium post.
[s2If !current_user_can(access_s2member_level4)]Please register for FREE REGISTER to read full post below containing analysis. In case of any error or you think you are not able to read the full post below, please email us at support#nehcap.com [lwa][/s2If] [s2If current_user_can(access_s2member_level1)]
- GBP/JPY could form a bullish-engulfing pattern if it reclaims 182.00.
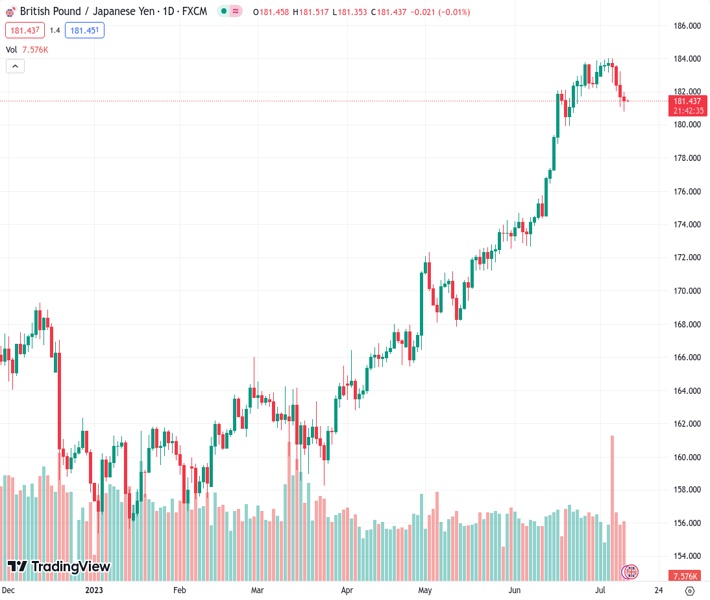
The pair currently trades last at 181.437.
The previous day high was 183.23 while the previous day low was 181.1. The daily 38.2% Fib levels comes at 181.91, expected to provide resistance. Similarly, the daily 61.8% fib level is at 182.42, expected to provide resistance.
The GBP/JPY slides for the fourth straight day after data from the United Kingdom (UK) bolstered the Pound Sterlin (GBP), as the pair bounced late in the session from Tuesday’s daily lows around 180.78. At the time of writing, the GBP/JPY is trading at 181.38, registering minuscule losses of 0.04% as the Asian session starts.
From a daily chart perspective, the GBP/JPY, after touching a weekly low of 180.78, buyers entered the market, lifting the pair back above the 181.00 mark. Tuesday’s candlestick reassembled a hammer, suggesting buying pressure outweighed sellers, which seem to have book profits, after UK’s data.
If GBP/JPY reclaims the 182.00 figure, that could form a bullish-engulfing candle pattern, suggesting further upside is expected. In that outcome, the GBP/JPY next resistance would be the Tenkan-Sen line at 182.40, followed by the 183.00 figure, ahead of the July 10 daily high at 183.22.
Conversely, GBP/JPY’s failure to crack 182.00 could exacerbate a continuation of the ongoing downtrend. That said, the first support would be 181.00. Once cleared, the next support would be the current weekly low of 180.78, followed by the Senkou Span A at 180.37, and then the 180.00 figure.
Technical Levels: Supports and Resistances
GBPJPY currently trading at 181.39 at the time of writing. Pair opened at 181.74 and is trading with a change of -0.19 % .
| Overview | Overview.1 | |
|---|---|---|
| 0 | Today last price | 181.39 |
| 1 | Today Daily Change | -0.35 |
| 2 | Today Daily Change % | -0.19 |
| 3 | Today daily open | 181.74 |
The pair is trading below its 20 Daily moving average @ 181.87, above its 50 Daily moving average @ 175.96 , above its 100 Daily moving average @ 170.04 and above its 200 Daily moving average @ 166.81
| Trends | Trends.1 | |
|---|---|---|
| 0 | Daily SMA20 | 181.87 |
| 1 | Daily SMA50 | 175.96 |
| 2 | Daily SMA100 | 170.04 |
| 3 | Daily SMA200 | 166.81 |
The previous day high was 183.23 while the previous day low was 181.1. The daily 38.2% Fib levels comes at 181.91, expected to provide resistance. Similarly, the daily 61.8% fib level is at 182.42, expected to provide resistance.
Note the levels of interest below:
- Pivot support is noted at 180.82, 179.9, 178.7
- Pivot resistance is noted at 182.94, 184.15, 185.07
| Levels | Levels.1 |
|---|---|
| Previous Daily High | 183.23 |
| Previous Daily Low | 181.10 |
| Previous Weekly High | 184.02 |
| Previous Weekly Low | 182.02 |
| Previous Monthly High | 183.88 |
| Previous Monthly Low | 172.67 |
| Daily Fibonacci 38.2% | 181.91 |
| Daily Fibonacci 61.8% | 182.42 |
| Daily Pivot Point S1 | 180.82 |
| Daily Pivot Point S2 | 179.90 |
| Daily Pivot Point S3 | 178.70 |
| Daily Pivot Point R1 | 182.94 |
| Daily Pivot Point R2 | 184.15 |
| Daily Pivot Point R3 | 185.07 |
[/s2If]
Download Nehcap EAWe have two EAs that are operational on our LIVE accounts.
- EA-FIX: Check out the details here. Download EA-FIX . EA-FIX is a non-grid HFT scalper.
- EA-GROWTH: High quality low dd EA using trend grids. Download EA_GROWTHJoin Our Telegram Group
")


