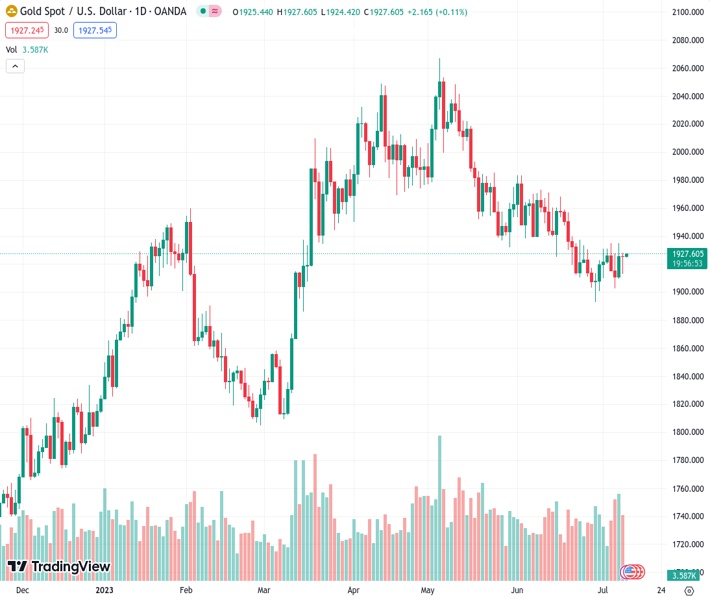
Gold price, currently trading at 1,927.17 in the XAUUSD market, is facing difficulties in maintaining its first weekly increase in four weeks due to conflicting signals. However, it has gained some momentum recently. Analysts predict that gold price is likely to experience more decline in the near future.
…
This is a premium post.
[s2If !current_user_can(access_s2member_level4)]Please register for FREE REGISTER to read full post below containing analysis. In case of any error or you think you are not able to read the full post below, please email us at support#nehcap.com [lwa][/s2If] [s2If current_user_can(access_s2member_level1)]
- Gold Price struggles to defend the first weekly gain in four amid mixed clues, picks up bids of late.
The pair currently trades last at 1927.17.
The previous day high was 1928.18 while the previous day low was 1912.74. The daily 38.2% Fib levels comes at 1922.28, expected to provide support. Similarly, the daily 61.8% fib level is at 1918.64, expected to provide support.
Gold Price (XAU/USD) picks up bids to renew intraday high around $1,928, after a sluggish start to the week, amid the mid-Asian session on Tuesday. It’s worth noting that the US Dollar’s broad weakness, due to the downbeat United States employment and inflation concerns, appears the key catalyst fueling the XAU/USD price. In doing so, the precious metal pays little attention to the looming economic fears emanating from China, as well as the hawkish Federal Reserve (Fed) speech.
Gold Price regains upside momentum, following a sluggish day, as the US Dollar Index (DXY) drops to the lowest level in two months near 101.90 during a four-day losing streak.
That said, downbeat United States inflation expectations follow the disappointment from the US employment data to weigh on the US Dollar and propel the XAU/USD Price.
As per the Federal Reserve Bank of New York’s monthly Survey of Consumer Expectations, the US consumers’ one-year inflation expectation dropped to the lowest level since April 2021 at 3.8% in June from 4.1% in May. It’s worth noting that the downbeat inflation signals raise expectations of witnessing a softer US Consumer Price Index (CPI), scheduled for Wednesday, which in turn doubts the latest hawkish Federal Reserve (Fed) comments and propels the Gold Price.
On Monday, San Francisco Fed President Mary Daly said, “We’re likely to need a couple more rate hikes over the course of this year to really bring inflation sustainably back to the Fed’s 2% goal.” On the same line, Cleveland Fed President Loretta Mester also said that the Fed will need to tighten the monetary policy “somewhat further” to lower inflation. Furthermore, Federal Reserve Vice Chair for Supervision Michael Barr said, “We are quite attentive to bringing inflation down to target.”
On the other hand, the latest US employment report for June marked a negative surprise and offered a big blow to the US Dollar, making it post the biggest daily loss in three weeks. However, Monday’s downbeat prints of China inflation data flagged fears of deflation in the world’s biggest industrial player, which in turn allowed the US Dollar to lick its wounds and check the Gold buyers.
That said, the headline US Nonfarm Payrolls (NFP) marked the first below-expectations print in 15 months while falling to 209K, versus 225K market forecasts and 309K prior (revised), whereas the Unemployment Rate matches analysts’ estimations of 3.6% compared to 3.7% prior. On the other hand, China’s Consumer Price Index (CPI) eased to 0.0% YoY in June versus 0.2% prior while the Producer Price Index (PPI) slipped beneath the -4.6% yearly prior marked in May to -5.4%.
Elsewhere, the US-China tension is also increasing and prodding the XAU/USD bulls. After her four-day visit to China, US Treasury Secretary Janet Yellen said that discussions were ‘direct’ and ‘productive’, which will stabilize the rocky US-Sino relationship. However, the policymaker also added, “The U.S. and China have significant disagreements.” On the other hand, China’s Finance Ministry said on Monday in a statement that they (China) urged the US to take practical actions in response to China’s major concerns about the US economic sanctions and crackdown. Given the dragon nation’s status as one of the biggest Gold Consumers, fears from Beijing prod the XAU/USD bulls.
It should be noted that the downbeat US Treasury bond yields also propel the Gold Price amid the cautious optimism in the markets. While portraying the mood, S&P500 Futures trace upbeat Wall Street performance while the US Treasury bond yields remain pressured. That said, the benchmark US 10-year Treasury bond yields printed the first daily loss in July the previous day whereas the two-year counterpart declined for the second consecutive day, to respectively near 4.00% and 4.86%
Moving on, Gold traders should pay attention to the aforementioned risk catalysts for clear directions ahead of Wednesday’s United States Consumer Price Index (CPI) for June.
Gold Price portrays a hidden bearish RSI divergence on the daily chart, despite posting the weekly gain in the last, not to forget defending the bulls past the 61.8% Fibonacci retracement of its February-May upside.
That said, the bearish oscillator formation can be witnessed when the price, Gold in this case, makes a lower high but the indicator, namely the Relative Strength Index (RSI), placed at 14, marks higher highs.
Adding strength to the downside bias about the XAU/USD is the inability to cross the 21-DMA resistance, around $1,930 by the press time.
The Gold sellers, however, need a daily closing below the $1,910 support confluence comprising a one-week-old rising trend line and the 61.8% Fibonacci retracement level, also known as the golden Fibonacci ratio.
Following that, the $1,900 round figure and the previous monthly low of near $1,893 might prod XAU/USD sellers before giving them control.
On the contrary, a daily closing beyond the 21-DMA hurdle of around $1,930 will try crossing the 50% Fibonacci retracement surrounding $1,943 ahead of targeting June’s peak of around $1,985.
Overall, the Gold price lacks upside momentum but the bears need an entry trigger.
Trend: Further weakness expected
Technical Levels: Supports and Resistances
XAUUSD currently trading at 1926.96 at the time of writing. Pair opened at 1925.29 and is trading with a change of 0.09% % .
| Overview | Overview.1 | |
|---|---|---|
| 0 | Today last price | 1926.96 |
| 1 | Today Daily Change | 1.67 |
| 2 | Today Daily Change % | 0.09% |
| 3 | Today daily open | 1925.29 |
The pair is trading below its 20 Daily moving average @ 1927.58, below its 50 Daily moving average @ 1960.85 , below its 100 Daily moving average @ 1948.83 and above its 200 Daily moving average @ 1867.66
| Trends | Trends.1 | |
|---|---|---|
| 0 | Daily SMA20 | 1927.58 |
| 1 | Daily SMA50 | 1960.85 |
| 2 | Daily SMA100 | 1948.83 |
| 3 | Daily SMA200 | 1867.66 |
The previous day high was 1928.18 while the previous day low was 1912.74. The daily 38.2% Fib levels comes at 1922.28, expected to provide support. Similarly, the daily 61.8% fib level is at 1918.64, expected to provide support.
Note the levels of interest below:
- Pivot support is noted at 1915.96, 1906.63, 1900.52
- Pivot resistance is noted at 1931.4, 1937.51, 1946.84
| Levels | Levels.1 |
|---|---|
| Previous Daily High | 1928.18 |
| Previous Daily Low | 1912.74 |
| Previous Weekly High | 1935.09 |
| Previous Weekly Low | 1902.77 |
| Previous Monthly High | 1983.50 |
| Previous Monthly Low | 1893.01 |
| Daily Fibonacci 38.2% | 1922.28 |
| Daily Fibonacci 61.8% | 1918.64 |
| Daily Pivot Point S1 | 1915.96 |
| Daily Pivot Point S2 | 1906.63 |
| Daily Pivot Point S3 | 1900.52 |
| Daily Pivot Point R1 | 1931.40 |
| Daily Pivot Point R2 | 1937.51 |
| Daily Pivot Point R3 | 1946.84 |
[/s2If]
Download Nehcap EAWe have two EAs that are operational on our LIVE accounts.
- EA-FIX: Check out the details here. Download EA-FIX . EA-FIX is a non-grid HFT scalper.
- EA-GROWTH: High quality low dd EA using trend grids. Download EA_GROWTHJoin Our Telegram Group
")


