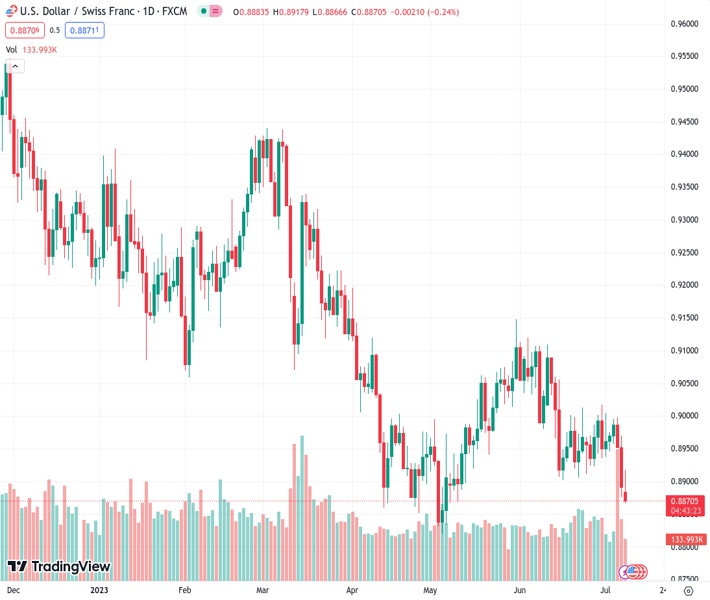
The USDCHF pair reached a high of 0.8915 before returning to 0.8870, erasing the gains it made during the day.
…
This is a premium post.
[s2If !current_user_can(access_s2member_level4)]Please register for FREE REGISTER to read full post below containing analysis. In case of any error or you think you are not able to read the full post below, please email us at support#nehcap.com [lwa][/s2If] [s2If current_user_can(access_s2member_level1)]
- The USD/CHF cleared daily gains, which saw the pair jumping to 0.8915 and settling at 0.8870.
The pair currently trades last at 0.88729.
The previous day high was 0.897 while the previous day low was 0.8876. The daily 38.2% Fib levels comes at 0.8912, expected to provide resistance. Similarly, the daily 61.8% fib level is at 0.8934, expected to provide resistance.
On Monday, the USD/CHF reversed its course and cleared daily gains, retreating to the 0.8870 area in negative territory. No high-tier data will be released, and several Federal Reserve (Fed) speakers will deliver speeches. Meanwhile, markets continue to asses Friday’s Nonfarm Payrolls report from the US, which came in mixed, ahead of inflation data to be released on Wednesday.
On Friday, the US Bureau of Labor Statistics revealed that the number of new jobs created in all non-agricultural businesses fell to 209K MoM in June while markets expected 225K, lower than the previous figure of 306K. However, wages increased by 0.4% MoM in the same month, higher than the 0.4% expected.
As a reaction, the US faced severe selling pressure as the lower-than-expected job creation figures made investors bet on a less aggressive Fed. That said, sticky wage inflation may pressure the Fed to maintain its aggressive stance and limit USD losses. In addition, the Consumer Price Index (CPI) data will provide additional information regarding the inflation outlook in the US. As for now, markets are expecting the headline figure to fall to 3.1% YoY in June and the Core figure to 5% from their previous 4% and 5.3% figures, respectively.
Regarding expectations, markets have already priced in a 25 basis point (bps) hike in the next July meeting, while the odds of another hike stand around 40%. Fed officials Loretta Mester and Mary Daly were on the wires on Monday and showed themselves hawkish, expressing that inflation is unacceptably high and that further hikes are appropriate but failed to boost the USD.
The daily chart suggests that the outlook favours the CHF over the USD in the short term. The Relative Strength Index (RSI) points south in negative territory, while the Moving Average Convergence Divergence (MACD) prints higher red bars, indicating a growing selling momentum. In addition, the pair trades below the 20,100 and 200-day Simple Moving Averages (SMAs)
Support Levels: 0.8860,0.8830,0.8820.
Resistance Levels: 0.8915, 0.8956 (20-day SMA), 0.8995.
Technical Levels: Supports and Resistances
USDCHF currently trading at 0.8869 at the time of writing. Pair opened at 0.8889 and is trading with a change of -0.22 % .
| Overview | Overview.1 | |
|---|---|---|
| 0 | Today last price | 0.8869 |
| 1 | Today Daily Change | -0.0020 |
| 2 | Today Daily Change % | -0.2200 |
| 3 | Today daily open | 0.8889 |
The pair remains strongly bearish on the daily time frame. It trades below the 20 SMA @ 0.8969, 50 SMA 0.8984, 100 SMA @ 0.9071 and 200 SMA @ 0.9282.
| Trends | Trends.1 | |
|---|---|---|
| 0 | Daily SMA20 | 0.8969 |
| 1 | Daily SMA50 | 0.8984 |
| 2 | Daily SMA100 | 0.9071 |
| 3 | Daily SMA200 | 0.9282 |
The previous day high was 0.897 while the previous day low was 0.8876. The daily 38.2% Fib levels comes at 0.8912, expected to provide resistance. Similarly, the daily 61.8% fib level is at 0.8934, expected to provide resistance.
Note the levels of interest below:
- Pivot support is noted at 0.8853, 0.8817, 0.8759
- Pivot resistance is noted at 0.8948, 0.9006, 0.9042
| Levels | Levels.1 |
|---|---|
| Previous Daily High | 0.8970 |
| Previous Daily Low | 0.8876 |
| Previous Weekly High | 0.9005 |
| Previous Weekly Low | 0.8876 |
| Previous Monthly High | 0.9120 |
| Previous Monthly Low | 0.8902 |
| Daily Fibonacci 38.2% | 0.8912 |
| Daily Fibonacci 61.8% | 0.8934 |
| Daily Pivot Point S1 | 0.8853 |
| Daily Pivot Point S2 | 0.8817 |
| Daily Pivot Point S3 | 0.8759 |
| Daily Pivot Point R1 | 0.8948 |
| Daily Pivot Point R2 | 0.9006 |
| Daily Pivot Point R3 | 0.9042 |
[/s2If]
Download Nehcap EAWe have two EAs that are operational on our LIVE accounts.
- EA-FIX: Check out the details here. Download EA-FIX . EA-FIX is a non-grid HFT scalper.
- EA-GROWTH: High quality low dd EA using trend grids. Download EA_GROWTHJoin Our Telegram Group
")


