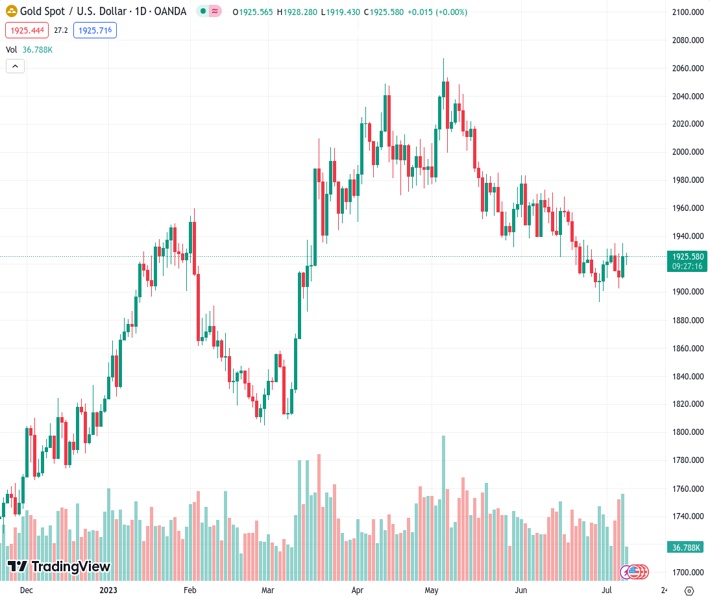
The gold price, currently at 1,924.32 in relation to the USD, is stabilizing above the $1,920.00 mark in anticipation of forthcoming US inflation data.
…
This is a premium post.
[s2If !current_user_can(access_s2member_level4)]Please register for FREE REGISTER to read full post below containing analysis. In case of any error or you think you are not able to read the full post below, please email us at support#nehcap.com [lwa][/s2If] [s2If current_user_can(access_s2member_level1)]
- Gold price is consolidating above $1,920.00 ahead of US inflation data.
The pair currently trades last at 1924.32.
The previous day high was 1934.89 while the previous day low was 1909.69. The daily 38.2% Fib levels comes at 1925.26, expected to provide resistance. Similarly, the daily 61.8% fib level is at 1919.32, expected to provide support.
Gold price (XAU/USD) is demonstrating a non-directional performance after correcting from a weekly high of $1,935.00 in the London session. The precious metal has turned topsy-turvy as investors are shifting their focus towards the United States Consumer Price Index (CPI) after the impact of the Nonfarm Payrolls (NFP) report.
Analysts at Well Fargo expect a surprisingly resilient labor market has helped to keep the United States economy expanding at a moderate pace despite continued fears about a recession. However, even amid more forthcoming labor supply and gradually cooling labor demand, the weight of the evidence still suggests that the labor market remains too tight to be consistent with 2% inflation.
Meanwhile, S&P500 futures have recovered decent losses generated in early Europe, portraying a recovery in the risk appetite of the market participants. The overall risk profile is still negative as the Federal Reserve (Fed) is going to resume its policy-tightening spell and will push interest rates to 5.25-5.50%. Investors should note that Fed chair Jerome Powell skipped the rate-hiking spree in its June monetary policy meeting.
The US Dollar Index (DXY) has rebounded after dropping to near 102.30. A sideways auction is expected in the USD Index ahead of US inflation data. As per the consensus, monthly headline CPI elevated at a higher pace of 0.3% vs. the prior pace of 0.1%. Annualized headline inflation is expected to soften to 3.1% against the former release of 4.0%. Declining gasoline prices have decelerated headline inflation, however, the major focus will be on the core inflation data.
Gold price is auctioning in an Ascending Triangle chart pattern on a two-hour scale. Upward-sloping trendline of the aforementioned chart pattern is plotted from June 29 low at $1,893.00 while the horizontal resistance is placed from June 21 high around $1,937.00.
The 200-period Exponential Moving Average (EMA) at $1,927.00 is acting as a barricade for the Gold bulls.
A 40.00-60.00 range oscillation by the Relative Strength Index (RSI) (14) indicates a non-directional performance.
Technical Levels: Supports and Resistances
XAUUSD currently trading at 1923.82 at the time of writing. Pair opened at 1925.0 and is trading with a change of -0.06 % .
| Overview | Overview.1 | |
|---|---|---|
| 0 | Today last price | 1923.82 |
| 1 | Today Daily Change | -1.18 |
| 2 | Today Daily Change % | -0.06 |
| 3 | Today daily open | 1925.00 |
The pair is trading below its 20 Daily moving average @ 1929.21, below its 50 Daily moving average @ 1961.99 , below its 100 Daily moving average @ 1947.99 and above its 200 Daily moving average @ 1866.34
| Trends | Trends.1 | |
|---|---|---|
| 0 | Daily SMA20 | 1929.21 |
| 1 | Daily SMA50 | 1961.99 |
| 2 | Daily SMA100 | 1947.99 |
| 3 | Daily SMA200 | 1866.34 |
The previous day high was 1934.89 while the previous day low was 1909.69. The daily 38.2% Fib levels comes at 1925.26, expected to provide resistance. Similarly, the daily 61.8% fib level is at 1919.32, expected to provide support.
Note the levels of interest below:
- Pivot support is noted at 1911.5, 1897.99, 1886.3
- Pivot resistance is noted at 1936.7, 1948.39, 1961.9
| Levels | Levels.1 |
|---|---|
| Previous Daily High | 1934.89 |
| Previous Daily Low | 1909.69 |
| Previous Weekly High | 1935.09 |
| Previous Weekly Low | 1902.77 |
| Previous Monthly High | 1983.50 |
| Previous Monthly Low | 1893.01 |
| Daily Fibonacci 38.2% | 1925.26 |
| Daily Fibonacci 61.8% | 1919.32 |
| Daily Pivot Point S1 | 1911.50 |
| Daily Pivot Point S2 | 1897.99 |
| Daily Pivot Point S3 | 1886.30 |
| Daily Pivot Point R1 | 1936.70 |
| Daily Pivot Point R2 | 1948.39 |
| Daily Pivot Point R3 | 1961.90 |
[/s2If]
Download Nehcap EAWe have two EAs that are operational on our LIVE accounts.
- EA-FIX: Check out the details here. Download EA-FIX . EA-FIX is a non-grid HFT scalper.
- EA-GROWTH: High quality low dd EA using trend grids. Download EA_GROWTHJoin Our Telegram Group
")


