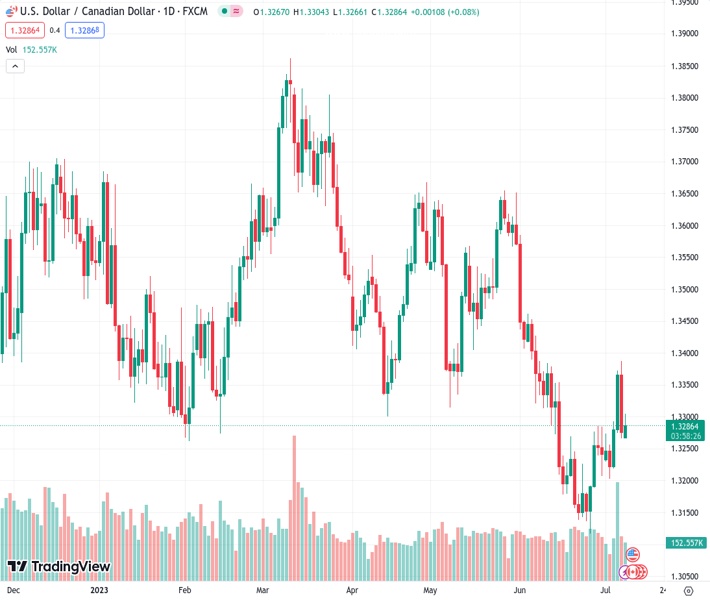
The currency pair USDCAD, currently trading at 1.32860, has created a bearish engulfing pattern and is finding it difficult to surpass the 1.3300 level. This suggests that there may be a potential decline in its value.
…
This is a premium post.
[s2If !current_user_can(access_s2member_level4)]Please register for FREE REGISTER to read full post below containing analysis. In case of any error or you think you are not able to read the full post below, please email us at support#nehcap.com [lwa][/s2If] [s2If current_user_can(access_s2member_level1)]
- USD/CAD forms a bearish engulfing pattern and struggles to breach the 1.3300 mark, signaling a possible downside.
The pair currently trades last at 1.32860.
The previous day high was 1.3387 while the previous day low was 1.3266. The daily 38.2% Fib levels comes at 1.3312, expected to provide resistance. Similarly, the daily 61.8% fib level is at 1.3341, expected to provide resistance.
USD/CAD bounces off the 20-day Exponential Moving Average (EMA) at 1.3278 after forming a bearish engulfing candlestick pattern, which suggests further downside is expected. Nevertheless, dynamic support spurred a jump in the USD/CAD exchange rates but fell short of cracking the 1.3300 figure. At the time of writing, the USD/CAD is trading at 1.3286 after hitting a daily high of 1.3304.
The USD/CAD remains neutral biased, capped on the upside by strong resistance levels, like the 50, 200, and 100-day EMAs, each at 1.3354, 1.3383, and 1.3411, respectively. Additionally, a bearish engulfing candle pattern suggests the pair might dip lower, with the 20-day EMA being the first support at 1.3278.
A breach of the latter will expose July’s 4 daily low of 1.3203. once cleared, the USD/CAD could extend its slide to the year-to-date (YTD) low of 1.3116.
Conversely, if USD/CAD reclaims 1.3300, the 50-day EMA at 1.3354 would be up for grabs. Next, resistance levels would emerge at the 200 EMA before buyers challenge 1.3400. Once broken, the USD/CAD could test the 100-day EMA at 1.3411.
Technical Levels: Supports and Resistances
USDCAD currently trading at 1.3287 at the time of writing. Pair opened at 1.3273 and is trading with a change of 0.11 % .
| Overview | Overview.1 | |
|---|---|---|
| 0 | Today last price | 1.3287 |
| 1 | Today Daily Change | 0.0014 |
| 2 | Today Daily Change % | 0.1100 |
| 3 | Today daily open | 1.3273 |
The pair is trading above its 20 Daily moving average @ 1.3244, below its 50 Daily moving average @ 1.3392 , below its 100 Daily moving average @ 1.3489 and below its 200 Daily moving average @ 1.3503
| Trends | Trends.1 | |
|---|---|---|
| 0 | Daily SMA20 | 1.3244 |
| 1 | Daily SMA50 | 1.3392 |
| 2 | Daily SMA100 | 1.3489 |
| 3 | Daily SMA200 | 1.3503 |
The previous day high was 1.3387 while the previous day low was 1.3266. The daily 38.2% Fib levels comes at 1.3312, expected to provide resistance. Similarly, the daily 61.8% fib level is at 1.3341, expected to provide resistance.
Note the levels of interest below:
- Pivot support is noted at 1.323, 1.3188, 1.3109
- Pivot resistance is noted at 1.3351, 1.343, 1.3472
| Levels | Levels.1 |
|---|---|
| Previous Daily High | 1.3387 |
| Previous Daily Low | 1.3266 |
| Previous Weekly High | 1.3387 |
| Previous Weekly Low | 1.3203 |
| Previous Monthly High | 1.3585 |
| Previous Monthly Low | 1.3117 |
| Daily Fibonacci 38.2% | 1.3312 |
| Daily Fibonacci 61.8% | 1.3341 |
| Daily Pivot Point S1 | 1.3230 |
| Daily Pivot Point S2 | 1.3188 |
| Daily Pivot Point S3 | 1.3109 |
| Daily Pivot Point R1 | 1.3351 |
| Daily Pivot Point R2 | 1.3430 |
| Daily Pivot Point R3 | 1.3472 |
[/s2If]
Download Nehcap EAWe have two EAs that are operational on our LIVE accounts.
- EA-FIX: Check out the details here. Download EA-FIX . EA-FIX is a non-grid HFT scalper.
- EA-GROWTH: High quality low dd EA using trend grids. Download EA_GROWTHJoin Our Telegram Group
")


