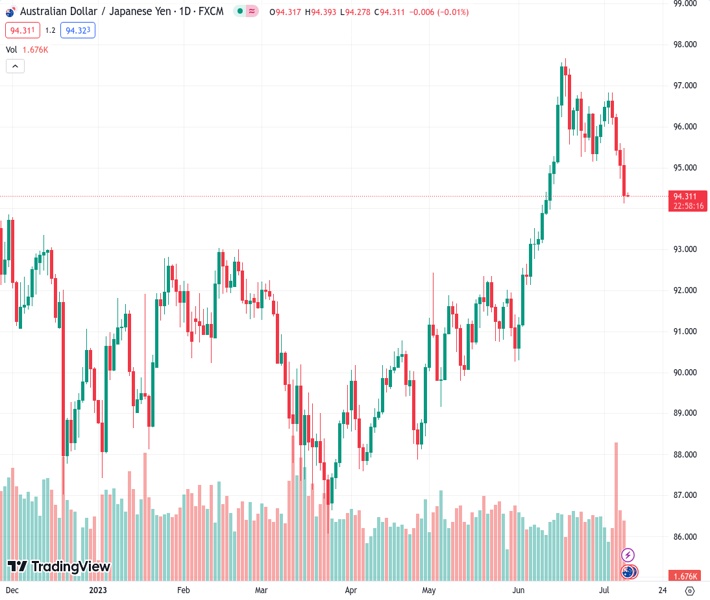
The AUDJPY pair, currently trading at 94.3290, is experiencing a continuous decline as it drops below the Kijun-Sen line and hits a low of 94.11, the lowest in the past four weeks.
…
This is a premium post.
[s2If !current_user_can(access_s2member_level4)]Please register for FREE REGISTER to read full post below containing analysis. In case of any error or you think you are not able to read the full post below, please email us at support#nehcap.com [lwa][/s2If] [s2If current_user_can(access_s2member_level1)]
- AUD/JPY continues to lose ground, falling below the Kijun-Sen line and reaching a four-week low at 94.11.
The pair currently trades last at 94.3290.
The previous day high was 95.59 while the previous day low was 94.74. The daily 38.2% Fib levels comes at 95.06, expected to provide resistance. Similarly, the daily 61.8% fib level is at 95.27, expected to provide resistance.
AUD/JPY extended its losses below the Kijun-Sen line after sellers broke technical support levels at around 95.18 before cracking the former at 94.90. The AUD/JPY slid to a new four-week low at 94.11 before stabilizing around current exchange rates. At the time of writing, the AUD/JPY is trading at 94.32, down 0.03% as the Asian session begins.
From a technical perspective, the AUD/JPY is still upward biased, as it remains above the Ichimoku Cloud, with the latest dip putting into play support levels not seen in a month. The 94.00 figure is next, followed by the Senkou Span B line at 93.41, and the December 13 daily high turned support at 93.35. If the cross falls below the latter, that could expose the 93.00 figure.
Conversely, the AUD/JPY buyers must reclaim the Kijun-Sen line at 95.18, so they can threaten to lift the pair above the Tenkan-Sen line at 95.47. In that outcome, the AUD/JPY’s next resistance would be the October 21 high at 95.74, ahead of reaching the 96.00 mark.
Technical Levels: Supports and Resistances
AUDJPY currently trading at 94.4 at the time of writing. Pair opened at 95.14 and is trading with a change of -0.78 % .
| Overview | Overview.1 | |
|---|---|---|
| 0 | Today last price | 94.40 |
| 1 | Today Daily Change | -0.74 |
| 2 | Today Daily Change % | -0.78 |
| 3 | Today daily open | 95.14 |
The pair is trading below its 20 Daily moving average @ 96.02, above its 50 Daily moving average @ 93.32 , above its 100 Daily moving average @ 91.48 and above its 200 Daily moving average @ 91.82
| Trends | Trends.1 | |
|---|---|---|
| 0 | Daily SMA20 | 96.02 |
| 1 | Daily SMA50 | 93.32 |
| 2 | Daily SMA100 | 91.48 |
| 3 | Daily SMA200 | 91.82 |
The previous day high was 95.59 while the previous day low was 94.74. The daily 38.2% Fib levels comes at 95.06, expected to provide resistance. Similarly, the daily 61.8% fib level is at 95.27, expected to provide resistance.
Note the levels of interest below:
- Pivot support is noted at 94.72, 94.31, 93.87
- Pivot resistance is noted at 95.58, 96.01, 96.43
| Levels | Levels.1 |
|---|---|
| Previous Daily High | 95.59 |
| Previous Daily Low | 94.74 |
| Previous Weekly High | 96.84 |
| Previous Weekly Low | 94.74 |
| Previous Monthly High | 97.68 |
| Previous Monthly Low | 90.30 |
| Daily Fibonacci 38.2% | 95.06 |
| Daily Fibonacci 61.8% | 95.27 |
| Daily Pivot Point S1 | 94.72 |
| Daily Pivot Point S2 | 94.31 |
| Daily Pivot Point S3 | 93.87 |
| Daily Pivot Point R1 | 95.58 |
| Daily Pivot Point R2 | 96.01 |
| Daily Pivot Point R3 | 96.43 |
[/s2If]
Download Nehcap EAWe have two EAs that are operational on our LIVE accounts.
- EA-FIX: Check out the details here. Download EA-FIX . EA-FIX is a non-grid HFT scalper.
- EA-GROWTH: High quality low dd EA using trend grids. Download EA_GROWTHJoin Our Telegram Group
")


